

Question: 5. Over time, the production possibilities curve can shift. Explain what may cause the curve to shift outward (to the right) or inward (to the
5. Over time, the production possibilities curve can shift. Explain what may cause the curve to shift outward (to the right) or inward (to the left). What would each of these shifts represent for the economy?
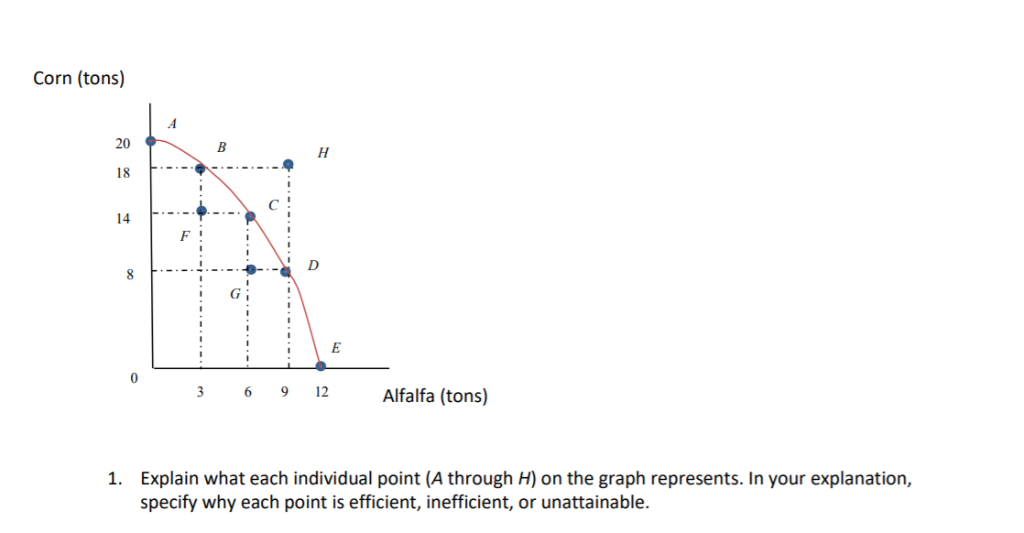
Corn (tons) 20 18 14 0 3 6 9 Alfalfa (tons) Explain what each individual point (A through H) on the graph represents. In your explanation, specify why each point is efficient, inefficient, or unattainable 1
Step by Step Solution
There are 3 Steps involved in it
1 Expert Approved Answer
Step: 1 Unlock

Question Has Been Solved by an Expert!
Get step-by-step solutions from verified subject matter experts
Step: 2 Unlock
Step: 3 Unlock