

5. Part 2: Torsion testing The aim of the torsion test is to find the shear...
Fantastic news! We've Found the answer you've been seeking!
Question:

Transcribed Image Text:
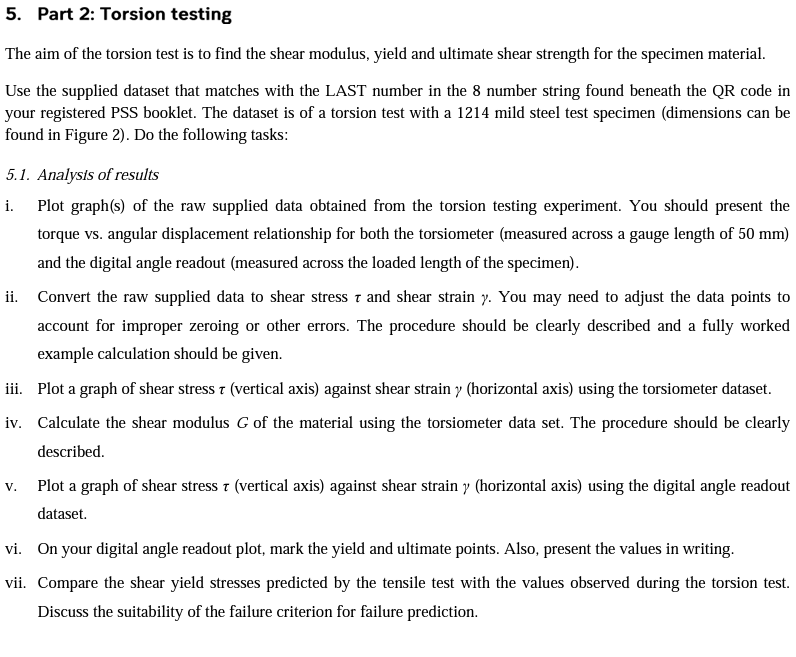
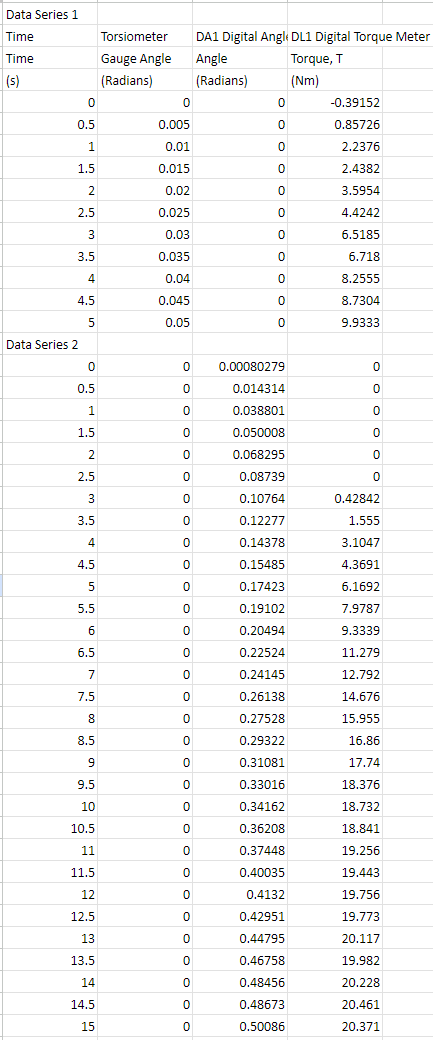
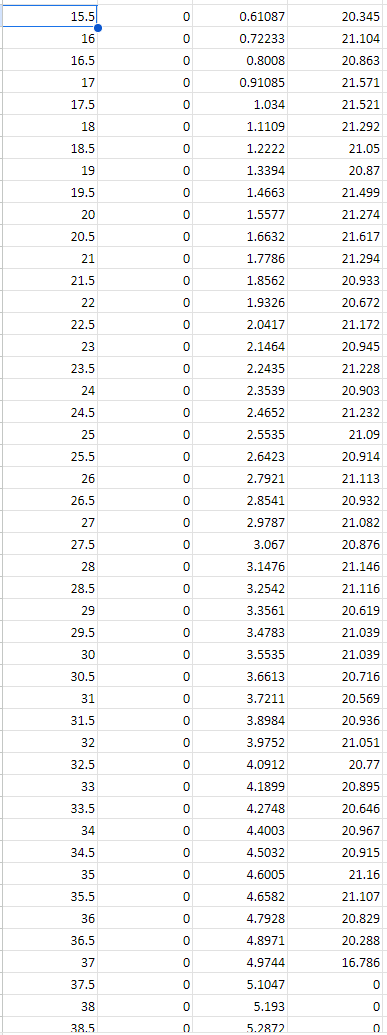
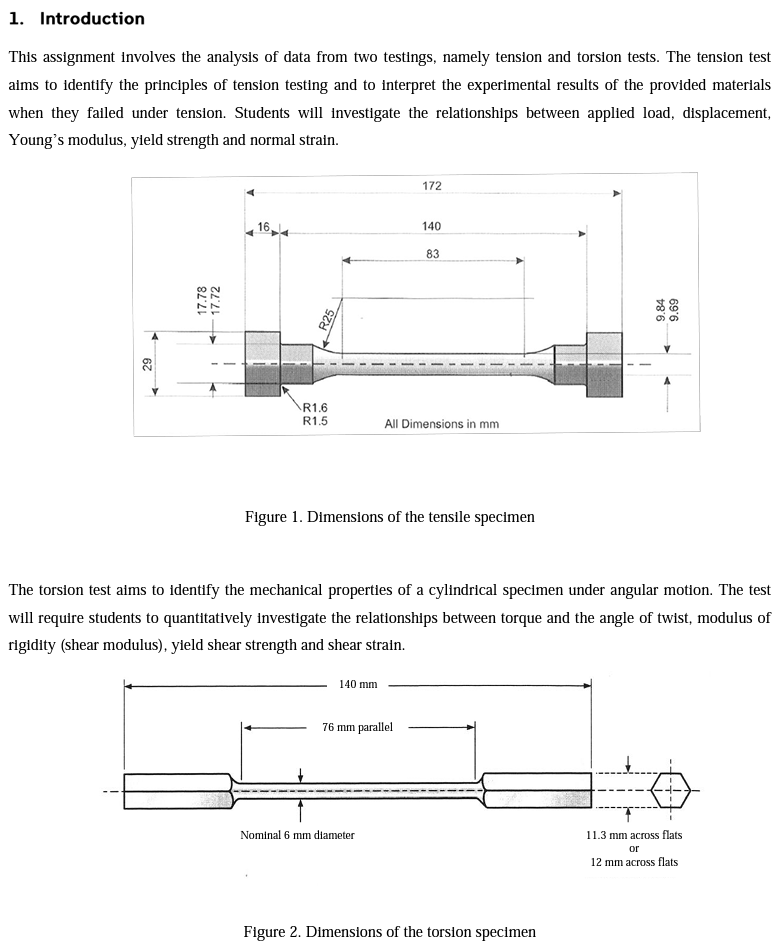
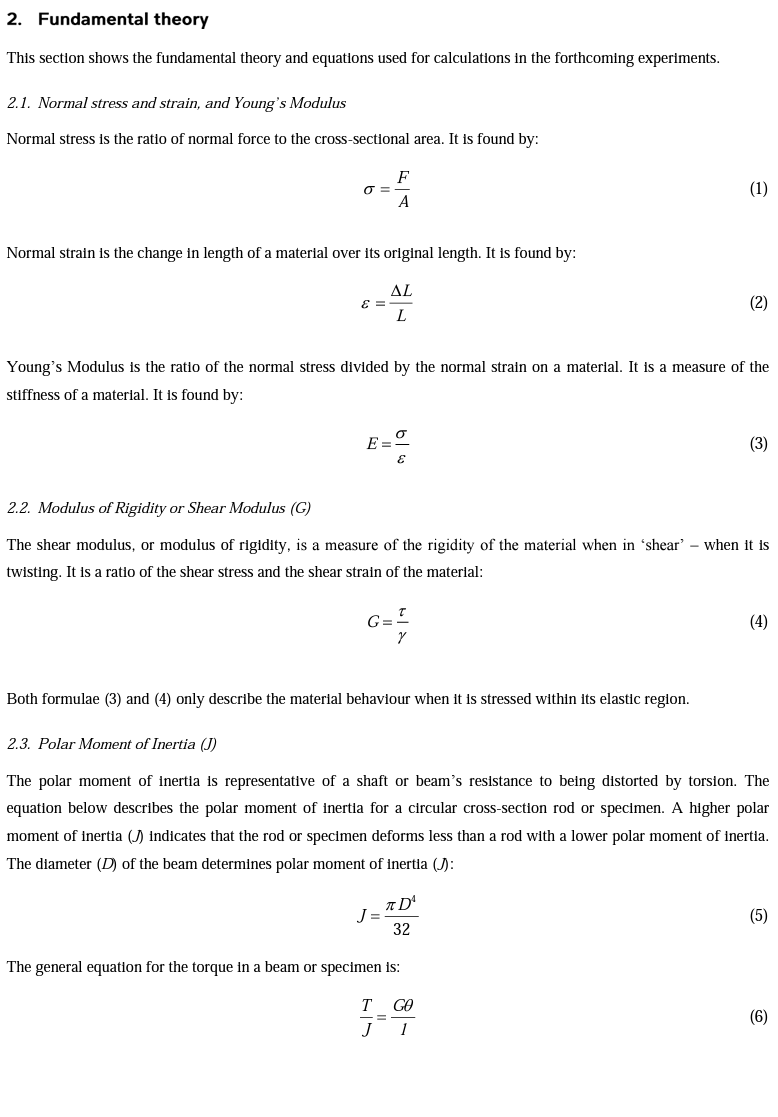
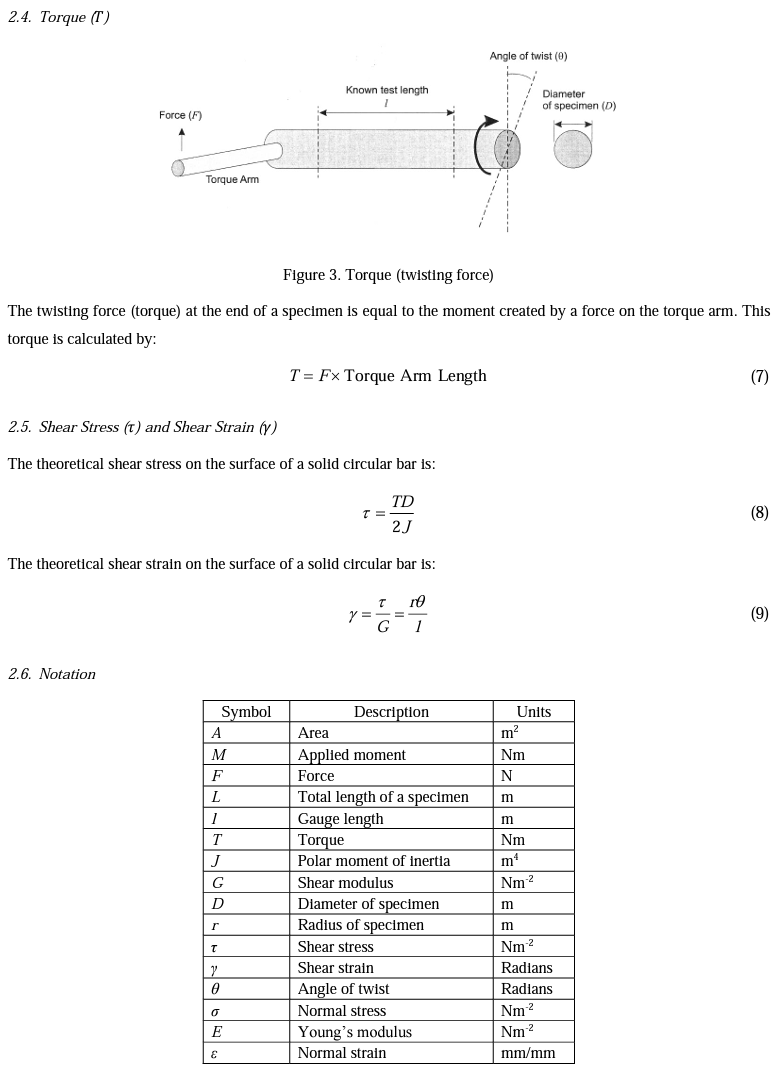
5. Part 2: Torsion testing The aim of the torsion test is to find the shear modulus, yield and ultimate shear strength for the specimen material. Use the supplied dataset that matches with the LAST number in the 8 number string found beneath the QR code in your registered PSS booklet. The dataset is of a torsion test with a 1214 mild steel test specimen (dimensions can be found in Figure 2). Do the following tasks: 5.1. Analysis of results i. Plot graph(s) of the raw supplied data obtained from the torsion testing experiment. You should present the torque vs. angular displacement relationship for both the torsiometer (measured across a gauge length of 50 mm) and the digital angle readout (measured across the loaded length of the specimen). ii. Convert the raw supplied data to shear stress 7 and shear strain y. You may need to adjust the data points to account for improper zeroing or other errors. The procedure should be clearly described and a fully worked example calculation should be given. iii. Plot a graph of shear stress 7 (vertical axis) against shear strain y (horizontal axis) using the torsiometer dataset. iv. Calculate the shear modulus G of the material using the torsiometer data set. The procedure should be clearly described. V. Plot a graph of shear stress 7 (vertical axis) against shear strain y (horizontal axis) using the digital angle readout dataset. vi. On your digital angle readout plot, mark the yield and ultimate points. Also, present the values in writing. vii. Compare the shear yield stresses predicted by the tensile test with the values observed during the torsion test. Discuss the suitability of the failure criterion for failure prediction. Data Series 1 Time Time (5) Data Series 2 Torsiometer DA1 Digital Angle DL1 Digital Torque Meter Gauge Angle Angle Torque, T (Radians) (Radians) (Nm) 0 0 0 -0.39152 0.5 0.005 0 0.85726 1 0.01 0 2.2376 1.5 0.015 0 2.4382 2 0.02 0 3.5954 2.5 0.025 0 4.4242 3 0.03 0 6.5185 3.5 0.035 0 6.718 4 0.04 0 8.2555 4.5 0.045 0 8.7304 5 0.05 0 9.9333 0 0 0.00080279 0 0.5 0 0.014314 0 1 0 0.038801 0 1.5 0 0.050008 0 2 0 0.068295 0 2.5 0 0.08739 0 3 0 0.10764 0.42842 3.5 0 0.12277 1.555 4 0 0.14378 3.1047 4.5 0 0.15485 4.3691 5 0 0.17423 6.1692 5.5 0 0.19102 7.9787 6 0 0.20494 9.3339 6.5 0 0.22524 11.279 7 0 0.24145 12.792 7.5 0 0.26138 14.676 8 0 0.27528 15.955 8.5 0 0.29322 16.86 9 0 0.31081 17.74 9.5 0 0.33016 18.376 10 0 0.34162 18.732 10.5 0 0.36208 18.841 11 0 0.37448 19.256 11.5 0 0.40035 19.443 12 0 0.4132 19.756 12.5 0 0.42951 19.773 13 0 0.44795 20.117 13.5 0 0.46758 19.982 14 0 0.48456 20.228 14.5 0 0.48673 20.461 15 0 0.50086 20.371 15.5 0 0.61087 20.345 16 0 0.72233 21.104 16.5 0 0.8008 20.863 17 0 0.91085 21.571 17.5 0 1.034 21.521 18 0 1.1109 21.292 18.5 0 1.2222 21.05 19 0 1.3394 20.87 19.5 0 1.4663 21.499 20 0 1.5577 21.274 20.5 0 1.6632 21.617 21 0 1.7786 21.294 21.5 0 1.8562 20.933 22 0 1.9326 20.672 22.5 0 2.0417 21.172 23 0 2.1464 20.945 23.5 0 2.2435 21.228 24 0 2.3539 20.903 24.5 0 2.4652 21.232 25 0 2.5535 21.09 25.5 0 2.6423 20.914 26 0 2.7921 21.113 26.5 0 2.8541 20.932 27 0 2.9787 21.082 27.5 0 3.067 20.876 28 0 3.1476 21.146 28.5 0 3.2542 21.116 29 0 3.3561 20.619 29.5 0 3.4783 21.039 30 0 3.5535 21.039 30.5 0 3.6613 20.716 31 0 3.7211 20.569 31.5 0 3.8984 20.936 32 0 3.9752 21.051 32.5 0 4.0912 20.77 33 0 4.1899 20.895 33.5 0 4.2748 20.646 34 0 4.4003 20.967 34.5 0 4.5032 20.915 35 0 4.6005 21.16 35.5 0 4.6582 21.107 36 0 4.7928 20.829 36.5 0 4.8971 20.288 37 0 4.9744 16.786 37.5 0 5.1047 0 38 0 5.193 0 38.5 0 5.2872 0 38.5 0 5.2872 0 39 0 5.3861 0 39.5 0 5.5266 0 1. Introduction This assignment involves the analysis of data from two testings, namely tension and torsion tests. The tension test aims to identify the principles of tension testing and to interpret the experimental results of the provided materials when they failed under tension. Students will investigate the relationships between applied load, displacement, Young's modulus, yield strength and normal strain. 29 17.78 17.72 164 R1.6 R25 172 140 83 R1.5 All Dimensions in mm Figure 1. Dimensions of the tensile specimen 9.84 69'6 The torsion test aims to identify the mechanical properties of a cylindrical specimen under angular motion. The test will require students to quantitatively investigate the relationships between torque and the angle of twist, modulus of rigidity (shear modulus), yield shear strength and shear strain. 140 mm 76 mm parallel Nominal 6 mm diameter Figure 2. Dimensions of the torsion specimen 11.3 mm across flats or 12 mm across flats 2. Fundamental theory This section shows the fundamental theory and equations used for calculations in the forthcoming experiments. 2.1. Normal stress and strain, and Young's Modulus Normal stress is the ratio of normal force to the cross-sectional area. It is found by: F A Normal strain is the change in length of a material over its original length. It is found by: = L (1) (2) Young's Modulus is the ratio of the normal stress divided by the normal strain on a material. It is a measure of the stiffness of a material. It is found by: E= (3) 2.2. Modulus of Rigidity or Shear Modulus (G) The shear modulus, or modulus of rigidity, is a measure of the rigidity of the material when in 'shear' - when it is twisting. It is a ratio of the shear stress and the shear strain of the material: G= I (4) Both formulae (3) and (4) only describe the material behaviour when it is stressed within its elastic region. 2.3. Polar Moment of Inertia (J) The polar moment of inertia is representative of a shaft or beam's resistance to being distorted by torsion. The equation below describes the polar moment of inertia for a circular cross-section rod or specimen. A higher polar moment of inertia () indicates that the rod or specimen deforms less than a rod with a lower polar moment of inertia. The diameter (D) of the beam determines polar moment of inertia (J): J D' 32 The general equation for the torque in a beam or specimen is: T GO J = 1 (5) (6) 2.4. Torque (T) Force (F) Torque Arm Known test length 1 Angle of twist (0) Diameter of specimen (D) Figure 3. Torque (twisting force) The twisting force (torque) at the end of a specimen is equal to the moment created by a force on the torque arm. This torque is calculated by: 2.5. Shear Stress (t) and Shear Strain (y) T=Fx Torque Arm Length The theoretical shear stress on the surface of a solid circular bar is: TD T= 2J The theoretical shear strain on the surface of a solid circular bar is: r0 1 y = G = 2.6. Notation Symbol Description Units A Area m M Applied moment Nm F Force N L Total length of a specimen m 1 EIS[SS[ Gauge length m T Torque Nm J Polar moment of inertia m G Shear modulus Nm D Diameter of specimen m Radius of specimen m Shear stress Nm Shear strain Radians 0 Angle of twist Radians Normal stress Nm Young's modulus Nm E Normal strain mm/mm (7) (8) (9) 5. Part 2: Torsion testing The aim of the torsion test is to find the shear modulus, yield and ultimate shear strength for the specimen material. Use the supplied dataset that matches with the LAST number in the 8 number string found beneath the QR code in your registered PSS booklet. The dataset is of a torsion test with a 1214 mild steel test specimen (dimensions can be found in Figure 2). Do the following tasks: 5.1. Analysis of results i. Plot graph(s) of the raw supplied data obtained from the torsion testing experiment. You should present the torque vs. angular displacement relationship for both the torsiometer (measured across a gauge length of 50 mm) and the digital angle readout (measured across the loaded length of the specimen). ii. Convert the raw supplied data to shear stress 7 and shear strain y. You may need to adjust the data points to account for improper zeroing or other errors. The procedure should be clearly described and a fully worked example calculation should be given. iii. Plot a graph of shear stress 7 (vertical axis) against shear strain y (horizontal axis) using the torsiometer dataset. iv. Calculate the shear modulus G of the material using the torsiometer data set. The procedure should be clearly described. V. Plot a graph of shear stress 7 (vertical axis) against shear strain y (horizontal axis) using the digital angle readout dataset. vi. On your digital angle readout plot, mark the yield and ultimate points. Also, present the values in writing. vii. Compare the shear yield stresses predicted by the tensile test with the values observed during the torsion test. Discuss the suitability of the failure criterion for failure prediction. Data Series 1 Time Time (5) Data Series 2 Torsiometer DA1 Digital Angle DL1 Digital Torque Meter Gauge Angle Angle Torque, T (Radians) (Radians) (Nm) 0 0 0 -0.39152 0.5 0.005 0 0.85726 1 0.01 0 2.2376 1.5 0.015 0 2.4382 2 0.02 0 3.5954 2.5 0.025 0 4.4242 3 0.03 0 6.5185 3.5 0.035 0 6.718 4 0.04 0 8.2555 4.5 0.045 0 8.7304 5 0.05 0 9.9333 0 0 0.00080279 0 0.5 0 0.014314 0 1 0 0.038801 0 1.5 0 0.050008 0 2 0 0.068295 0 2.5 0 0.08739 0 3 0 0.10764 0.42842 3.5 0 0.12277 1.555 4 0 0.14378 3.1047 4.5 0 0.15485 4.3691 5 0 0.17423 6.1692 5.5 0 0.19102 7.9787 6 0 0.20494 9.3339 6.5 0 0.22524 11.279 7 0 0.24145 12.792 7.5 0 0.26138 14.676 8 0 0.27528 15.955 8.5 0 0.29322 16.86 9 0 0.31081 17.74 9.5 0 0.33016 18.376 10 0 0.34162 18.732 10.5 0 0.36208 18.841 11 0 0.37448 19.256 11.5 0 0.40035 19.443 12 0 0.4132 19.756 12.5 0 0.42951 19.773 13 0 0.44795 20.117 13.5 0 0.46758 19.982 14 0 0.48456 20.228 14.5 0 0.48673 20.461 15 0 0.50086 20.371 15.5 0 0.61087 20.345 16 0 0.72233 21.104 16.5 0 0.8008 20.863 17 0 0.91085 21.571 17.5 0 1.034 21.521 18 0 1.1109 21.292 18.5 0 1.2222 21.05 19 0 1.3394 20.87 19.5 0 1.4663 21.499 20 0 1.5577 21.274 20.5 0 1.6632 21.617 21 0 1.7786 21.294 21.5 0 1.8562 20.933 22 0 1.9326 20.672 22.5 0 2.0417 21.172 23 0 2.1464 20.945 23.5 0 2.2435 21.228 24 0 2.3539 20.903 24.5 0 2.4652 21.232 25 0 2.5535 21.09 25.5 0 2.6423 20.914 26 0 2.7921 21.113 26.5 0 2.8541 20.932 27 0 2.9787 21.082 27.5 0 3.067 20.876 28 0 3.1476 21.146 28.5 0 3.2542 21.116 29 0 3.3561 20.619 29.5 0 3.4783 21.039 30 0 3.5535 21.039 30.5 0 3.6613 20.716 31 0 3.7211 20.569 31.5 0 3.8984 20.936 32 0 3.9752 21.051 32.5 0 4.0912 20.77 33 0 4.1899 20.895 33.5 0 4.2748 20.646 34 0 4.4003 20.967 34.5 0 4.5032 20.915 35 0 4.6005 21.16 35.5 0 4.6582 21.107 36 0 4.7928 20.829 36.5 0 4.8971 20.288 37 0 4.9744 16.786 37.5 0 5.1047 0 38 0 5.193 0 38.5 0 5.2872 0 38.5 0 5.2872 0 39 0 5.3861 0 39.5 0 5.5266 0 1. Introduction This assignment involves the analysis of data from two testings, namely tension and torsion tests. The tension test aims to identify the principles of tension testing and to interpret the experimental results of the provided materials when they failed under tension. Students will investigate the relationships between applied load, displacement, Young's modulus, yield strength and normal strain. 29 17.78 17.72 164 R1.6 R25 172 140 83 R1.5 All Dimensions in mm Figure 1. Dimensions of the tensile specimen 9.84 69'6 The torsion test aims to identify the mechanical properties of a cylindrical specimen under angular motion. The test will require students to quantitatively investigate the relationships between torque and the angle of twist, modulus of rigidity (shear modulus), yield shear strength and shear strain. 140 mm 76 mm parallel Nominal 6 mm diameter Figure 2. Dimensions of the torsion specimen 11.3 mm across flats or 12 mm across flats 2. Fundamental theory This section shows the fundamental theory and equations used for calculations in the forthcoming experiments. 2.1. Normal stress and strain, and Young's Modulus Normal stress is the ratio of normal force to the cross-sectional area. It is found by: F A Normal strain is the change in length of a material over its original length. It is found by: = L (1) (2) Young's Modulus is the ratio of the normal stress divided by the normal strain on a material. It is a measure of the stiffness of a material. It is found by: E= (3) 2.2. Modulus of Rigidity or Shear Modulus (G) The shear modulus, or modulus of rigidity, is a measure of the rigidity of the material when in 'shear' - when it is twisting. It is a ratio of the shear stress and the shear strain of the material: G= I (4) Both formulae (3) and (4) only describe the material behaviour when it is stressed within its elastic region. 2.3. Polar Moment of Inertia (J) The polar moment of inertia is representative of a shaft or beam's resistance to being distorted by torsion. The equation below describes the polar moment of inertia for a circular cross-section rod or specimen. A higher polar moment of inertia () indicates that the rod or specimen deforms less than a rod with a lower polar moment of inertia. The diameter (D) of the beam determines polar moment of inertia (J): J D' 32 The general equation for the torque in a beam or specimen is: T GO J = 1 (5) (6) 2.4. Torque (T) Force (F) Torque Arm Known test length 1 Angle of twist (0) Diameter of specimen (D) Figure 3. Torque (twisting force) The twisting force (torque) at the end of a specimen is equal to the moment created by a force on the torque arm. This torque is calculated by: 2.5. Shear Stress (t) and Shear Strain (y) T=Fx Torque Arm Length The theoretical shear stress on the surface of a solid circular bar is: TD T= 2J The theoretical shear strain on the surface of a solid circular bar is: r0 1 y = G = 2.6. Notation Symbol Description Units A Area m M Applied moment Nm F Force N L Total length of a specimen m 1 EIS[SS[ Gauge length m T Torque Nm J Polar moment of inertia m G Shear modulus Nm D Diameter of specimen m Radius of specimen m Shear stress Nm Shear strain Radians 0 Angle of twist Radians Normal stress Nm Young's modulus Nm E Normal strain mm/mm (7) (8) (9)
Expert Answer:

Related Book For 

Essentials Of Statistics For The Behavioral Sciences
ISBN: 9781464107771
3rd Edition
Authors: Susan A. Nolan
Posted Date:
Students also viewed these mechanical engineering questions
-
t Housing Data Square footage Frequency 0-499 5 500-999 17 1,000-1,499 33 1,500-1,999 121 2,000 - 2,499 119 2,500 - 2,999 81 3,000-3,499 47 3,500-3,999 45 4,000-4,499 4,500-4,999 422 10 D Print Done...
-
Question 4: A psychologist is investigating the effects of background music and lighting conditions on problem-solving abilities. The study involves two independent variables: Background Music: a....
-
Q1. You have identified a market opportunity for home media players that would cater for older members of the population. Many older people have difficulty in understanding the operating principles...
-
A close company which prepares accounts to 31 March each year is owned and managed by a single shareholder/director who is not a Scottish taxpayer and who is paid a salary of 5,000 per month. In...
-
Develop the stoichiometric equation for the combustion in air of a) Methane, b) Benzene, c) Octane, d) Propane, and e) Ethane.
-
For the correlation matrix in Problem 31 in Chapter 10, find the proportion of variance in the weekly grocery bill (Y) determined by family size (X) alone, by income (Z) alone, and by family size and...
-
In the same situation what aspects of local action influence global thinking?? LO1
-
(a) Belinda believes that the couple could maintain their current level of living if their retirement income represented 75 percent of their current annual income after adjusting for inflation....
-
Can you help with a multiple step financial statement? cant get it to balance. Accounts Payable $40,344 BS Accounts Receivable (Gross) $49,307 BS Accumulated Depreciation (Equipment) -$11,825 BS...
-
In early 2016, Doc and Lyn McGee formed the McGee Cake Company. The company produced a full line of cakes, and its specialties included chess cake,* lemon pound cake, and double-iced, double...
-
Describe the business and corporate strategies used by Apple during Steve Jobs' second tenure and also during Tim Cook's tenure. https://bohatala.com/apple-case-study-analysis-summary/...
-
Briefly explain the difference between a k-factor model and the capital asset pricing model
-
Refer to the cost data, Picture below. Take off the square feet of wall forms and cubic yards of ready mix concrete for the walls of the elevator pit. Determine the total material and labor cost for...
-
possible Submit quiz A researcher studies water clarity at the same location in a lake on the same dates during the course of a year and repeats the measurements on the same dates 5 years later. The...
-
A liquid hydrocarbon mixture was made by adding 295 kg of benzene, 289 kg of toluene and 287 kg of p-xylene. Assume there is no change of volume upon mixing, i.e., Vmix=0 , in order to determine: 1....
-
b) Maseru Development Bank has R850 million credit with Matsieng Hydroelectric Power, with a maturity of eighteen months. The expected loss for Maseru Development Bank is R22 million, and the...
-
What discount rate would make you indifferent between receiving $3,510.00 per year forever and $5,331.00 per year for 24.00 years? Assume the first payment of both cash flow streams occurs in one...
-
The following information is for Montreal Gloves Inc. for the year 2020: Manufacturing costs Number of gloves manufactured Beginning inventory $ 3,016,700 311,000 pairs 0 pairs Sales in 2020 were...
-
Lets consider whether U.S. college football teams are more likely or less likely to be mismatched in the upper National Collegiate Athletic Association (NCAA) divisions. Overall, the 53 Football Bowl...
-
How can you convert a scatterplot into a range-frame?
-
How are statistical powe r and effect size different but related?
-
2 Elabore una matriz para comparar los cinco elementos de la mezcla promocional basndose en tres criterios: a quin se entrega el mensaje , qu decir y cundo decirlo.
-
1 Despus de escuchar una presentacin de ventas reciente, Mary Smith se inscribi como socia del club deportivo local. Al llegar a las instalaciones, se enter de que haba que pagar una cuota adicional...
-
17-12. Cmo han cambiado las agencias de publicidad para facilitar el uso de los programas de IMC ?
Written Communication Soft Skills For A Digital Workplace 3rd Edition - ISBN: 1337119296 - Free Book

Study smarter with the SolutionInn App