

Question: 5. Pie Charts: A Pie Chart is a circle divided into category. Compute the size for each sector: Marital Status, 2006 proportional to the
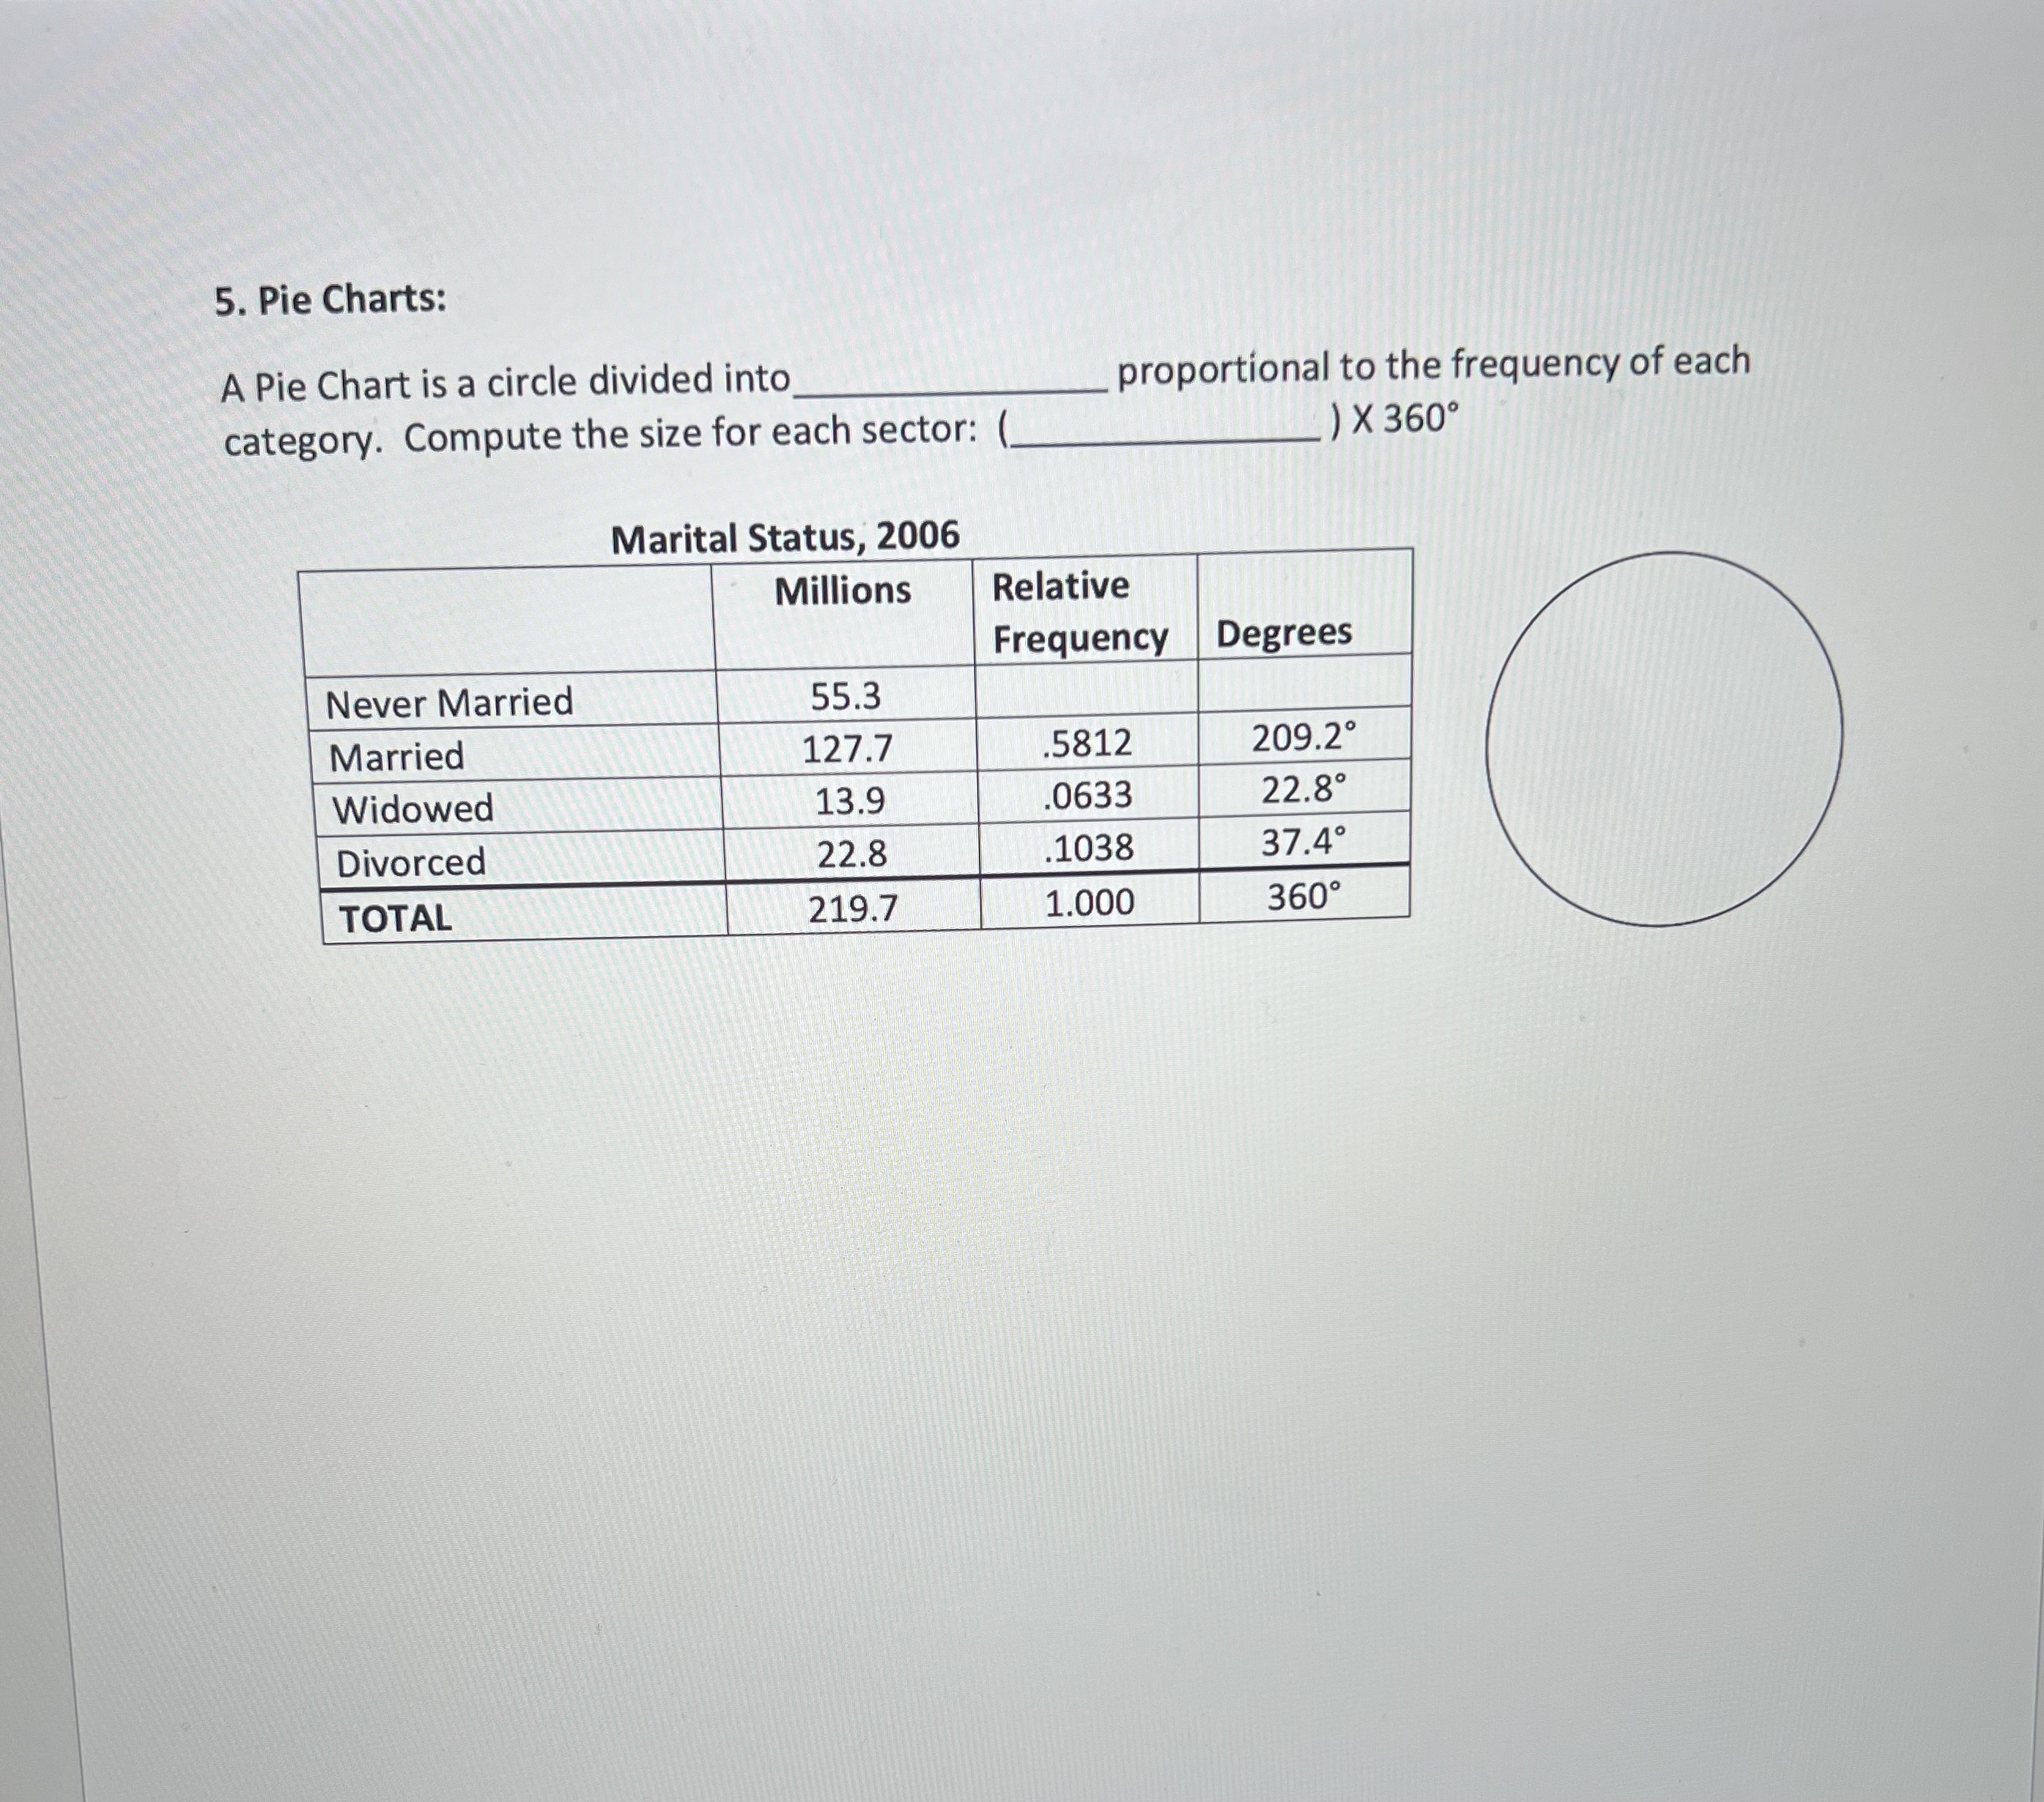
5. Pie Charts: A Pie Chart is a circle divided into category. Compute the size for each sector: Marital Status, 2006 proportional to the frequency of each ) X 360 Never Married Married Widowed Divorced TOTAL Millions Relative Frequency Degrees 55.3 127.7 .5812 209.2 13.9 .0633 22.8 22.8 .1038 37.4 219.7 1.000 360
Step by Step Solution
There are 3 Steps involved in it
1 Expert Approved Answer
Step: 1 Unlock

To compute the missing relative frequency you add the total g... View full answer
Question Has Been Solved by an Expert!
Get step-by-step solutions from verified subject matter experts
Step: 2 Unlock
Step: 3 Unlock