

Question: (5 points) Consider the following spider plot and the data table to answer the following question. Spider Plot mm - SAS. 5. $15.00 R SIS.
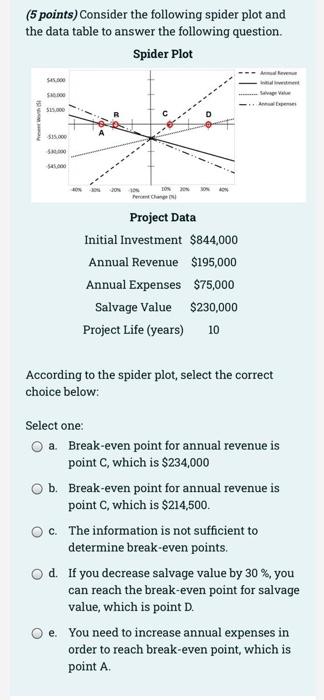
(5 points) Consider the following spider plot and the data table to answer the following question. Spider Plot mm - SAS. 5. $15.00 R SIS. 50 S. Perth Project Data Initial Investment $844,000 Annual Revenue $195,000 Annual Expenses $75,000 Salvage Value $230,000 Project Life (years) 10 According to the spider plot, select the correct choice below: Select one: a. Break-even point for annual revenue is point C, which is $234,000 Ob. Break-even point for annual revenue is point C, which is $214,500. c. The information is not sufficient to determine break-even points. d. If you decrease salvage value by 30 %, you can reach the break-even point for salvage value, which is point D. Oe. You need to increase annual expenses in order to reach break-even point, which is point A
Step by Step Solution
There are 3 Steps involved in it

Get step-by-step solutions from verified subject matter experts