

Question: #5 Quantitative SAT scores are approximately Normally distributed with a mean of 500 and a standard deviation of 100. Choose the correct technology output for


#5
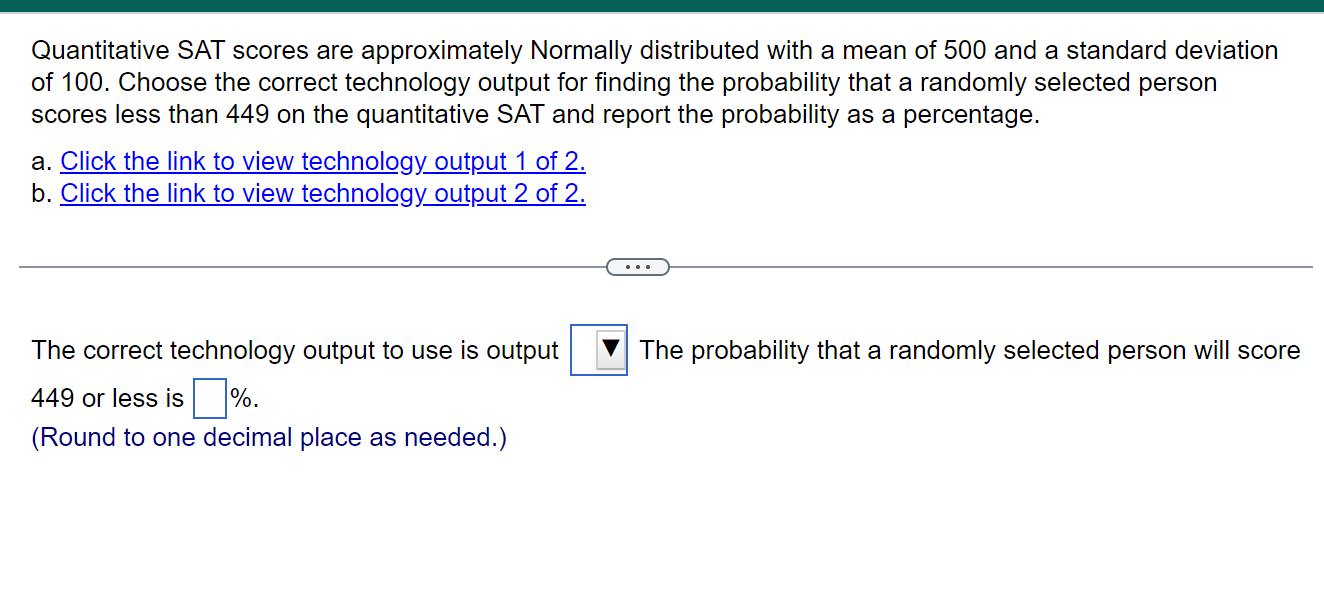
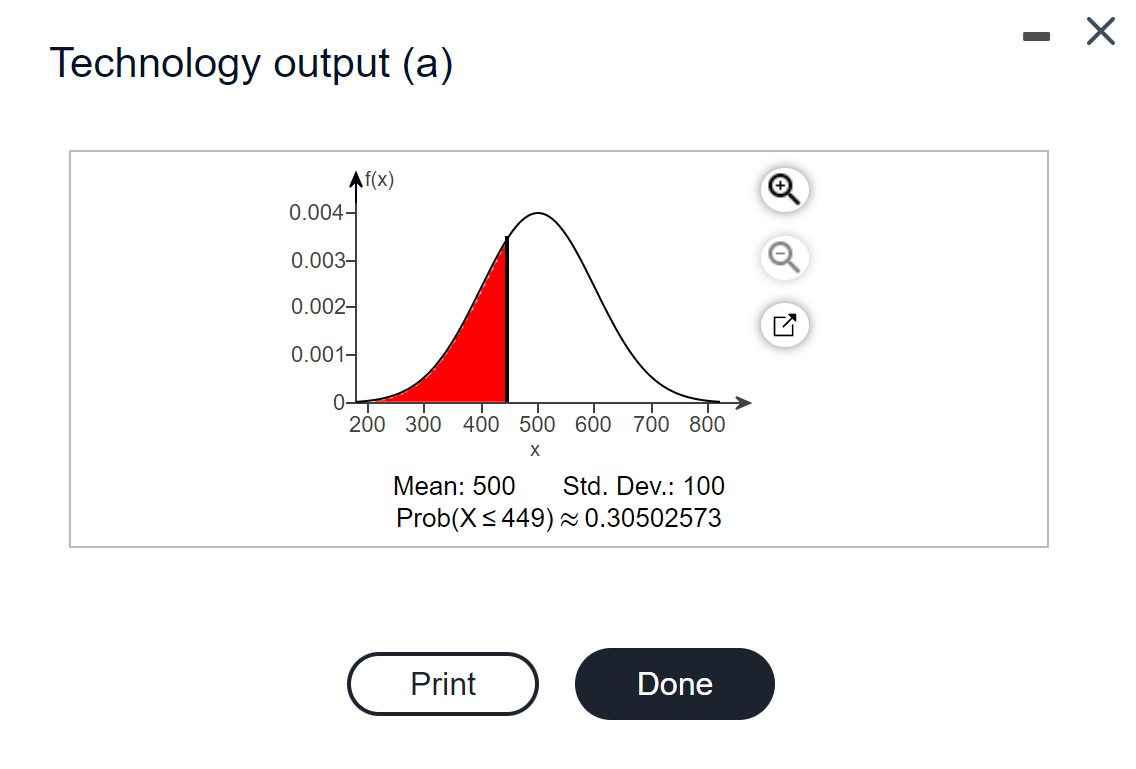


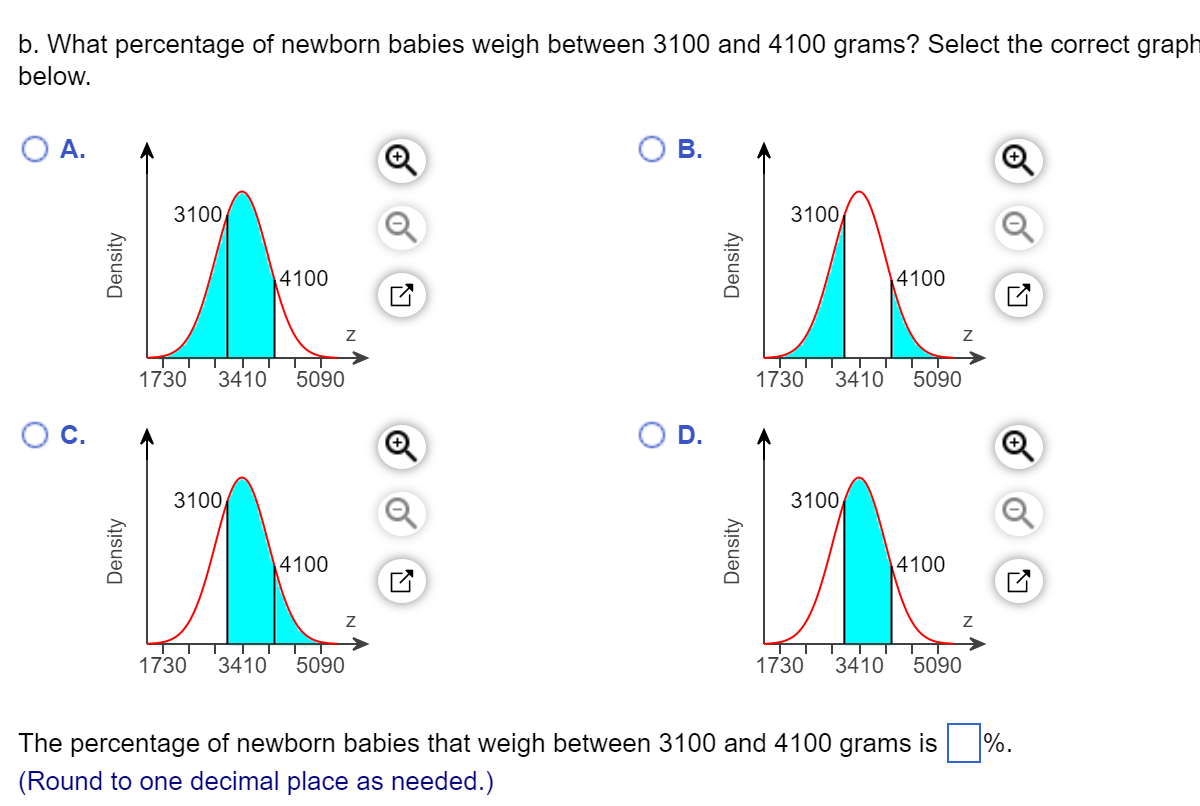
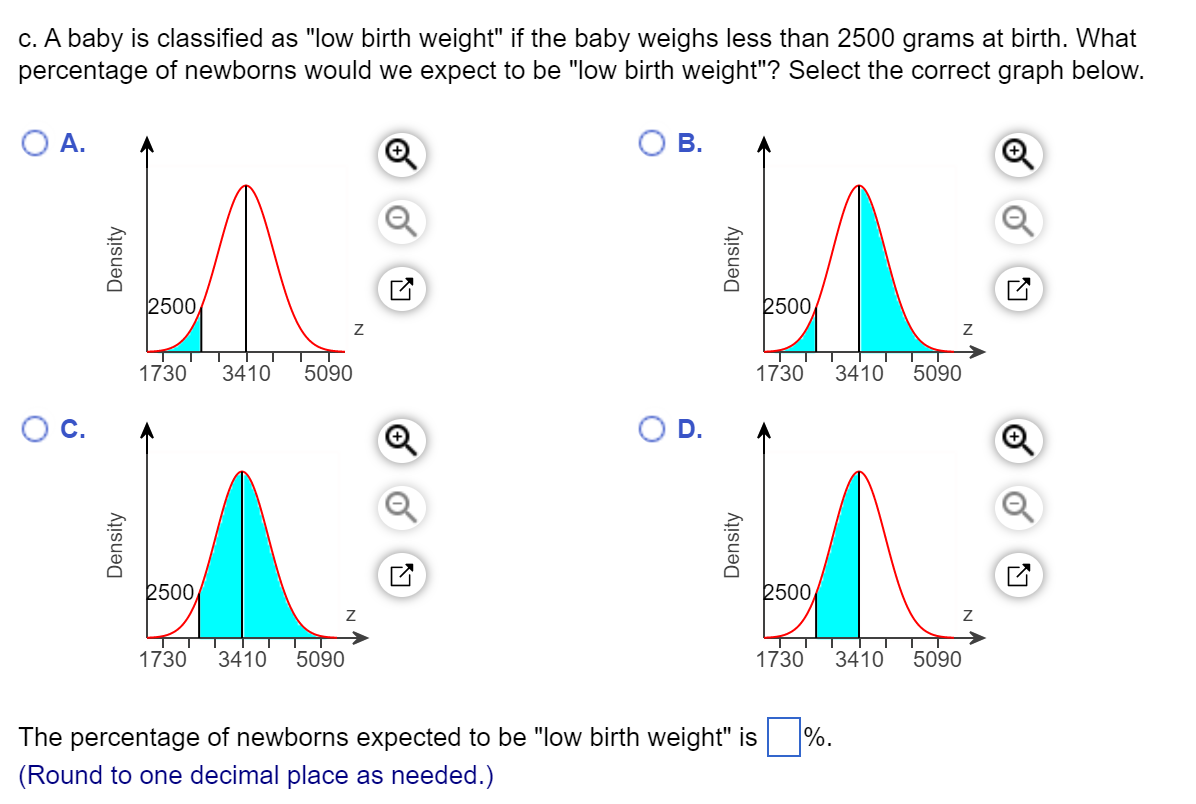
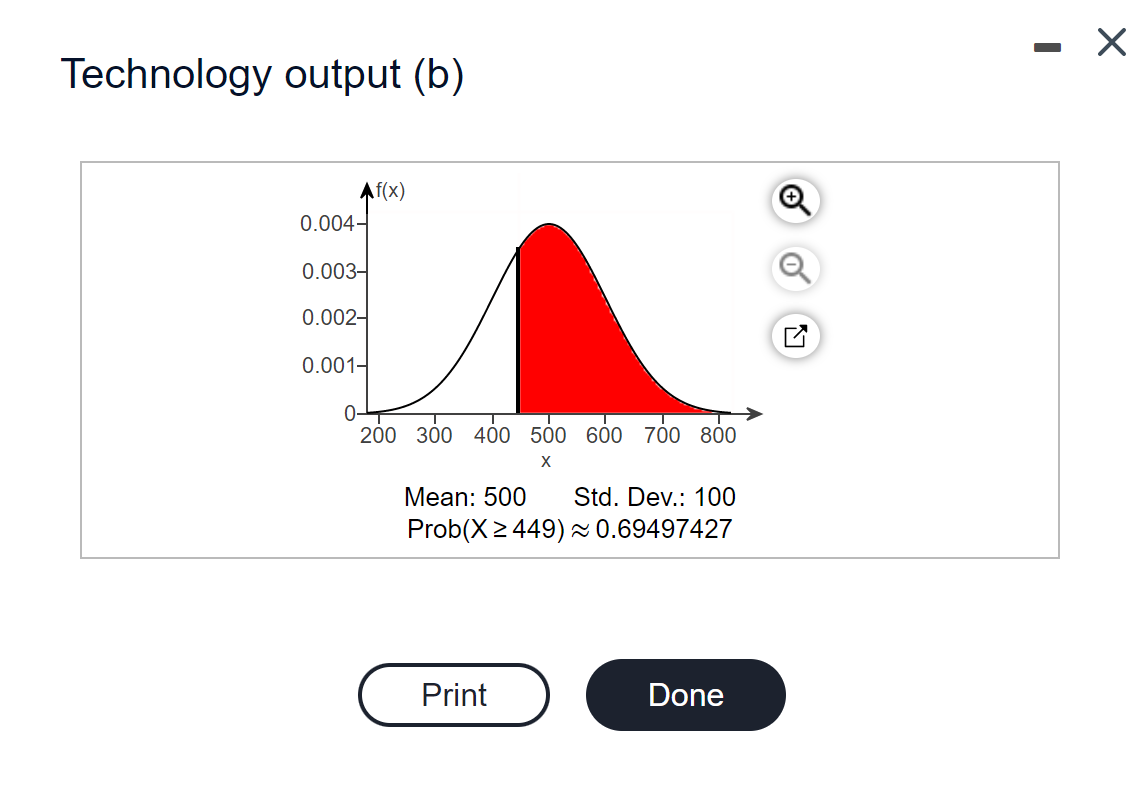
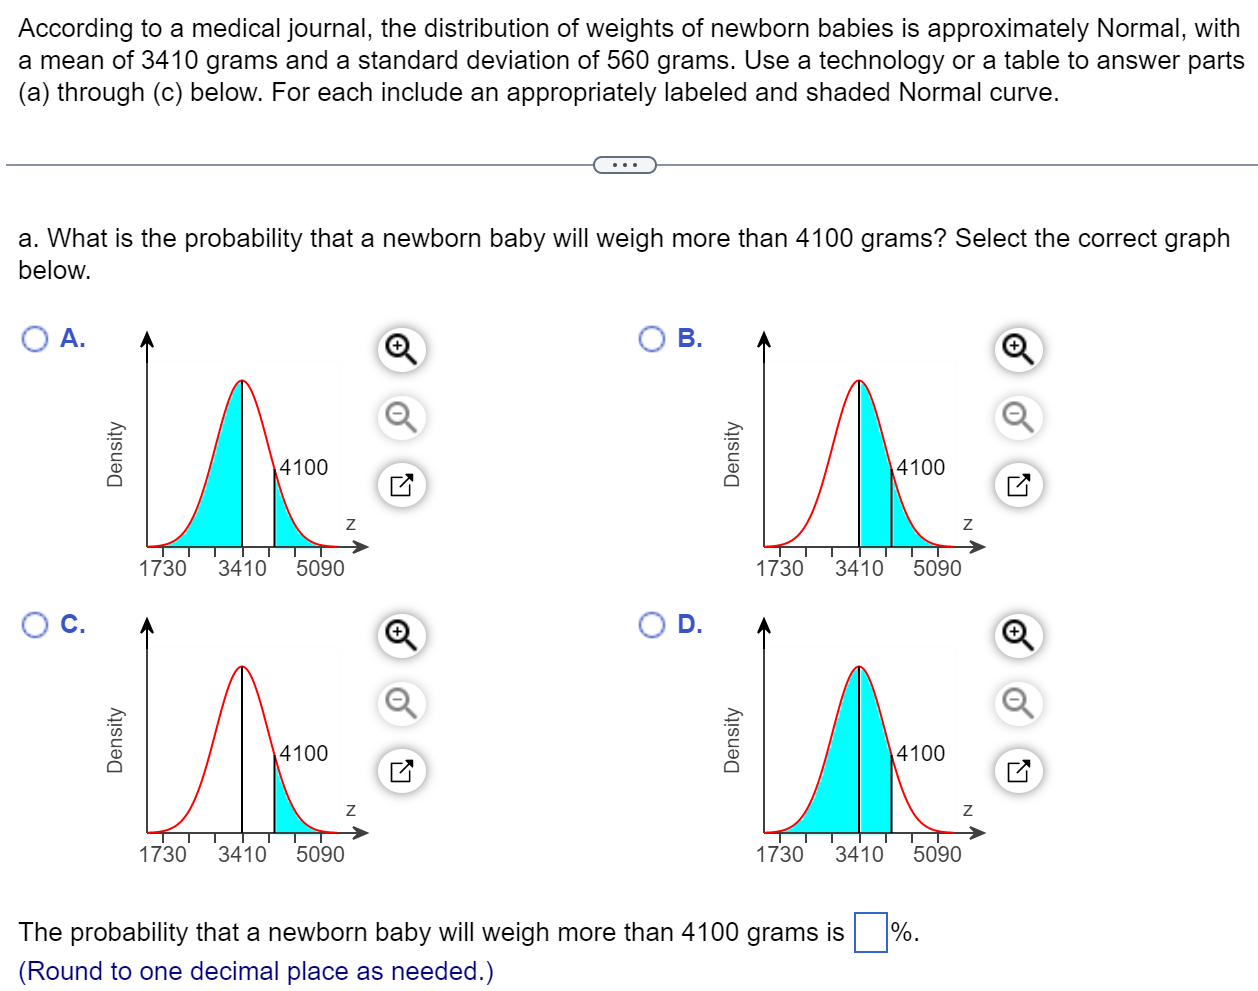
Quantitative SAT scores are approximately Normally distributed with a mean of 500 and a standard deviation of 100. Choose the correct technology output for finding the probability that a randomly selected person scores less than 449 on the quantitative SAT and report the probability as a percentage. a. Click the link to view technology output 1 of 2. b. Click the link to view technology output 2 of 2. . . . The correct technology output to use is output The probability that a randomly selected person will score 449 or less is %. (Round to one decimal place as needed.)\f- X Technology output (b) + 0.004- 0.003- 0.001- X Mean: 500 Std. Dev.: 100 Prob(X 2 449) ~ 0.69497427 Print DoneAccording to a medical journal, the distribution of weights of newborn babies is approximately Normal, with a mean of 3410 grams and a standard deviation of 560 grams. Use a technology or a table to answer parts (a) through (0) below. For each include an appropriately labeled and shaded Normal curve. a. What is the probability that a newborn baby will weigh more than 4100 grams? Select the correct graph below. OA- Q OB. Q ,o ,0 4100 4100 Densy Densy Z Z 1730 3410 5090 1730 3410 5090 o C) ,o 0 C3 ,9 ,o ,0 4100 4100 Densy Densy Z Z 1730 3410 5090 1730 3410 5090 The probability that a newborn baby will weigh more than 4100 grams is Elli/o. (Round to one decimal place as needed.) b. What percentage of newborn babies weigh between 3100 and 4100 grams? Select the correct graph below. O A. + O B. + 3100 Density Density 4100 Z 1730 3410 5090 O C. + O D. + 3100 3100 Density Density 4100 4100 Z Z 1730 3410 5090 1730 3410 5090 The percentage of newborn babies that weigh between 3100 and 4100 grams is %. (Round to one decimal place as needed.)c. A baby is classified as "low birth weight" if the baby weighs less than 2500 grams at birth. What percentage of newborns would we expect to be "low birth weight"? Select the correct graph below. O A. + O B. + Density Density 2500 2500 Z Z 1730 3410 5090 1730 3410 5090 O C. + OD. Density Density 2500 2500 N Z 1730 3410 5090 1730 3410 5090 The percentage of newborns expected to be "low birth weight" is |%. (Round to one decimal place as needed.)
Step by Step Solution
There are 3 Steps involved in it

Get step-by-step solutions from verified subject matter experts