

Question: 5. Regression Analysis. To test whether the immediate market response to earnings surprises announced on a Friday is slower than for those announced on
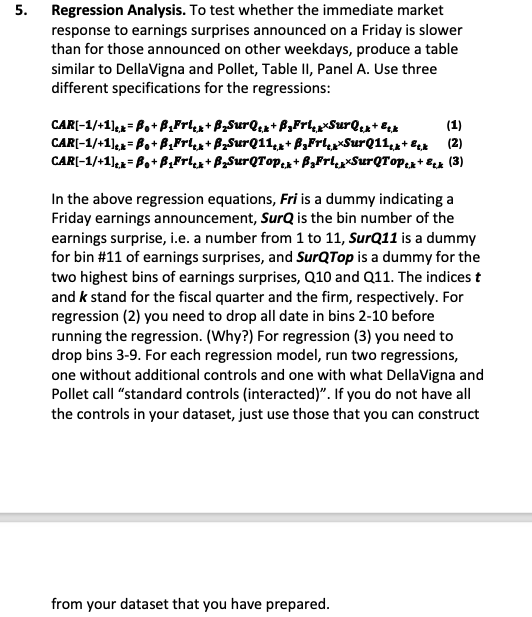
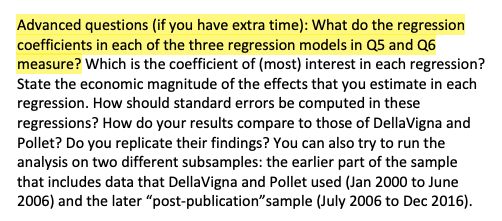
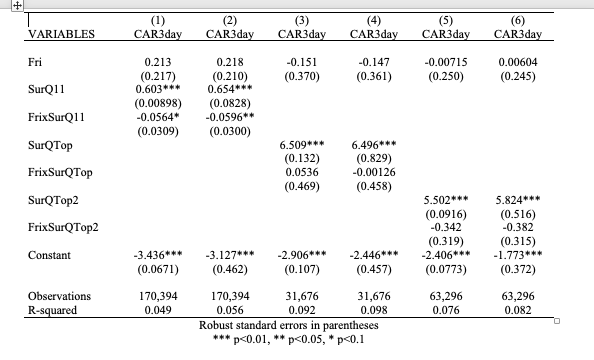
5. Regression Analysis. To test whether the immediate market response to earnings surprises announced on a Friday is slower than for those announced on other weekdays, produce a table similar to DellaVigna and Pollet, Table II, Panel A. Use three different specifications for the regressions: (1) CAR[-1/+1] = Po + BFrlx+SurQk+BFrlx*SurQ+k+ k CAR[-1/+1] = Po + BFrlx+SurQ11k+ Frlx*SurQ11x+kk (2) CAR[-1/+1] = Po + BFrl+SurQTop+BFrSurQTopek+ Eck (3) In the above regression equations, Fri is a dummy indicating a Friday earnings announcement, SurQ is the bin number of the earnings surprise, i.e. a number from 1 to 11, SurQ11 is a dummy for bin #11 of earnings surprises, and SurQTop is a dummy for the two highest bins of earnings surprises, Q10 and Q11. The indices t and k stand for the fiscal quarter and the firm, respectively. For regression (2) you need to drop all date in bins 2-10 before running the regression. (Why?) For regression (3) you need to drop bins 3-9. For each regression model, run two regressions, one without additional controls and one with what DellaVigna and Pollet call "standard controls (interacted)". If you do not have all the controls in your dataset, just use those that you can construct from your dataset that you have prepared. Advanced questions (if you have extra time): What do the regression coefficients in each of the three regression models in Q5 and Q6 measure? Which is the coefficient of (most) interest in each regression? State the economic magnitude of the effects that you estimate in each regression. How should standard errors be computed in these regressions? How do your results compare to those of DellaVigna and Pollet? Do you replicate their findings? You can also try to run the analysis on two different subsamples: the earlier part of the sample that includes data that DellaVigna and Pollet used (Jan 2000 to June 2006) and the later "post-publication"sample (July 2006 to Dec 2016). + (1) (2) (3) (4) VARIABLES CAR3day CAR3day CAR3day CAR3day (5) CAR3day (6) CAR3day Fri 0.213 0.218 -0.151 -0.147 -0.00715 0.00604 SurQ11 (0.217) 0.603*** (0.210) 0.654*** (0.370) (0.361) (0.250) (0.245) (0.00898) (0.0828) FrixSurQ11 -0.0564* -0.0596** (0.0309) (0.0300) SurQTop 6.509*** 6.496*** (0.132) (0.829) FrixSurQTop 0.0536 -0.00126 (0.469) (0.458) SurQTop2 5.502*** (0.0916) 5.824*** (0.516) FrixSurQTop2 -0.342 -0.382 (0.319) (0.315) Constant -3.436*** -3.127*** -2.906*** -2.446*** -2.406*** -1.773*** (0.0671) (0.462) (0.107) (0.457) (0.0773) (0.372) Observations R-squared 170,394 170,394 31,676 31,676 63,296 63,296 0.049 0.056 0.092 0.098 0.076 0.082 Robust standard errors in parentheses *** p
Step by Step Solution
There are 3 Steps involved in it

Get step-by-step solutions from verified subject matter experts