

Question: 5 Risk Return Quiz 35 Problem 5-11 Saved Help Save & Exit Subm Using historical risk premiums from Table 5.5 over the 1927-2018 period
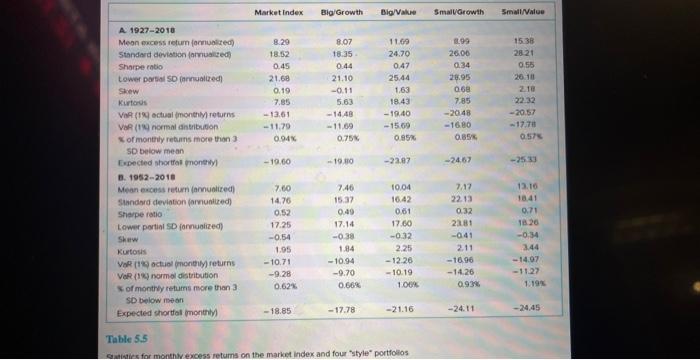
5 Risk Return Quiz 35 Problem 5-11 Saved Help Save & Exit Subm Using historical risk premiums from Table 5.5 over the 1927-2018 period as your guide, what would be your estimate of the expected annual HPR on the Big/Value portfolio if the current risk-free interest rate is 3% ? (Round your answer to 2 decimal places.) Expected annual HPR % Market Index Big Growth Big/Value Small/Growth Small/Value A 1927-2018 Meon excess return (annualized) 8.29 8.07 11.09 1.99 15.38 Standard deviation (annualized) 18.52 18.35 24.70 26.06 28.21 Sharpe ratio 0.45 0.44 0.47 0.34) 0.55 Lower partial SD (annualized) 21.68 21.10 25.44 28.95 26.18 Skew 0.19 -0.11 1.63 068 2.18 Kurtous 7.85 5.63 18.43 7.85 22.32 VaR (1%) actual (monthly) returns -13.61 -14.48 -19.40 -20.48 -20.57 VaR (19) normal distribution -11.79 -11.69 -15.69 -16.80 -17.78 % of monthly returns more than 3 0.94% 0.75% 0.85% 0.85% 0.57% SD below mean Expected shortfall (monthly) -19.60 -19.80 -23.07 -24.67 -25.33 B. 1952-2018 Mean excess return (annualized) 7.60 7.46 10.04 7.17 13.16 Standard deviation (annualized) 14.76 15.37 16.42 22.13 18.41 Sharpe ratio - 0.52 0.49 0.61 0.32 0.71 Lower partial SD (annualized) 17.25 17.14 17.60 23.81 18.26 Skew -0.54 -0.38 -0.32 -041 -0.34 Kurtosis 1.95 1.84 2.25 2.11 3.44 VaR (1% actual (monthly) returns -10.71 -10.94 -12.26 -16.96 -14.97 VeR (1%) normal distribution -9.28 -9.70 -10.19 -14.26 -11.27 % of monthly retums more than 31 0.62% 0.66% 1.00% 0.93% 1.19% SD below mean Expected shortfall (monthly) -18.85 -17.78 -21.16 -24.11 -24.45 Table 5.5 Statistics for monthly excess returns on the market index and four "style" portfolios
Step by Step Solution
There are 3 Steps involved in it

Get step-by-step solutions from verified subject matter experts