

Question: 5. Sketch the graph the following function: f(x) = - (4) , and then state a) the range b) the equation of the asymptote c)
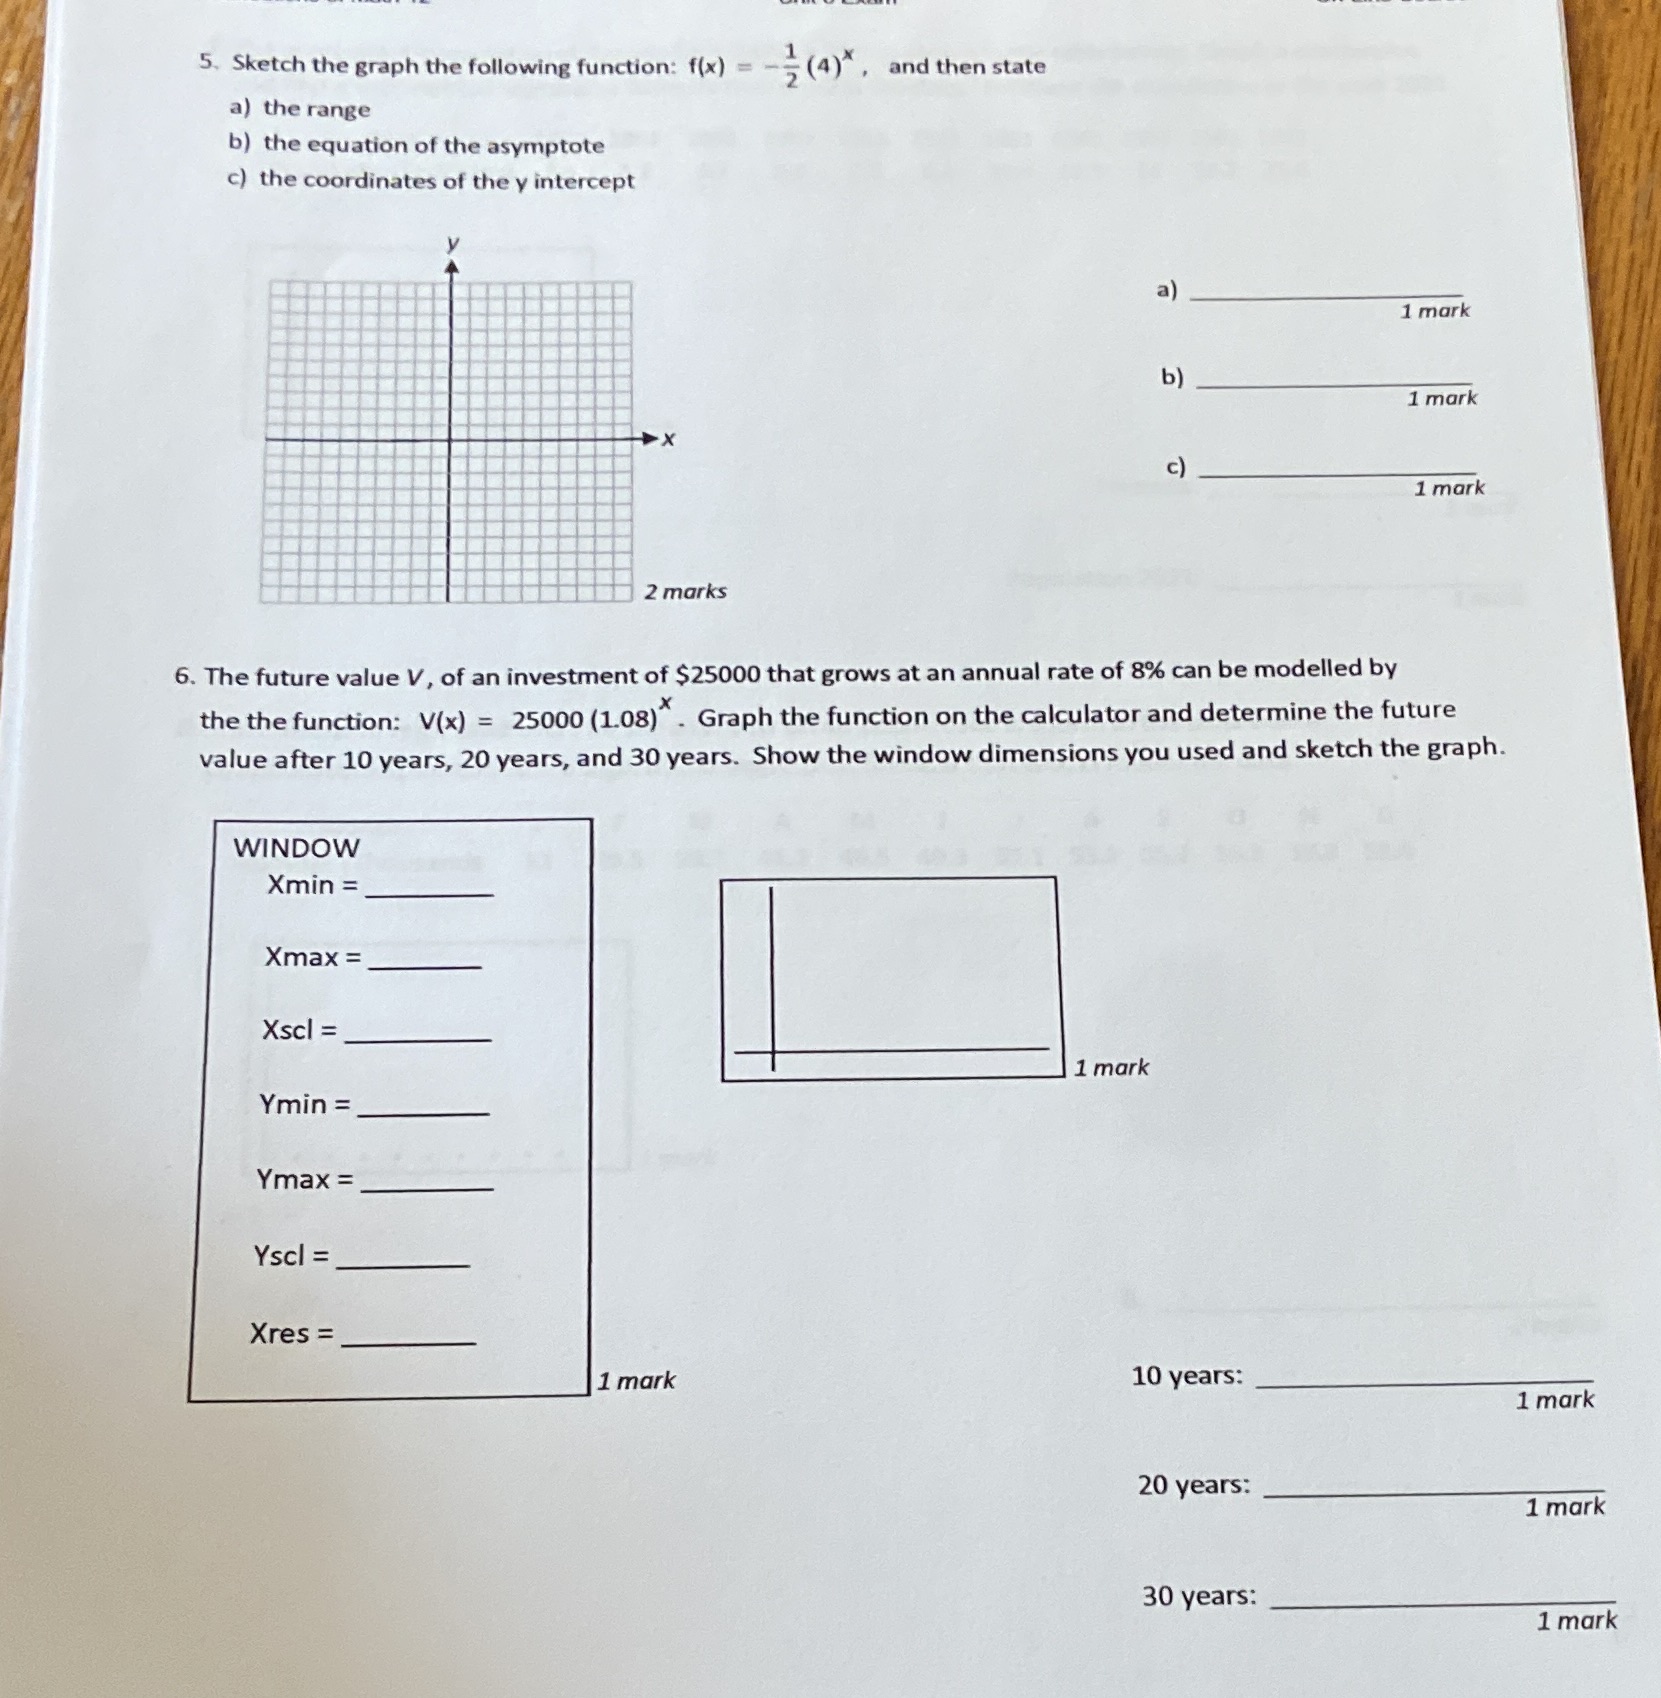
5. Sketch the graph the following function: f(x) = - (4) , and then state a) the range b) the equation of the asymptote c) the coordinates of the y intercept a) 1 mark b) 1 mark C ) 1 mark 2 marks 6. The future value V, of an investment of $25000 that grows at an annual rate of 8% can be modelled by the the function: V(x) = 25000 (1.08)". Graph the function on the calculator and determine the future value after 10 years, 20 years, and 30 years. Show the window dimensions you used and sketch the graph. WINDOW Xmin = Xmax = Xscl = 1 mark Ymin = Ymax = Yscl = Xres = 1 mark 10 years: 1 mark 20 years: 1 mark 30 years: 1 mark
Step by Step Solution
There are 3 Steps involved in it
1 Expert Approved Answer
Step: 1 Unlock

Question Has Been Solved by an Expert!
Get step-by-step solutions from verified subject matter experts
Step: 2 Unlock
Step: 3 Unlock