Question: 5 STAT HOMEWORK QUESTIONS 1. A Step 4: Do you reject or not reject the null hypothesis? What does this mean in the context of
5 STAT HOMEWORK QUESTIONS
1. A
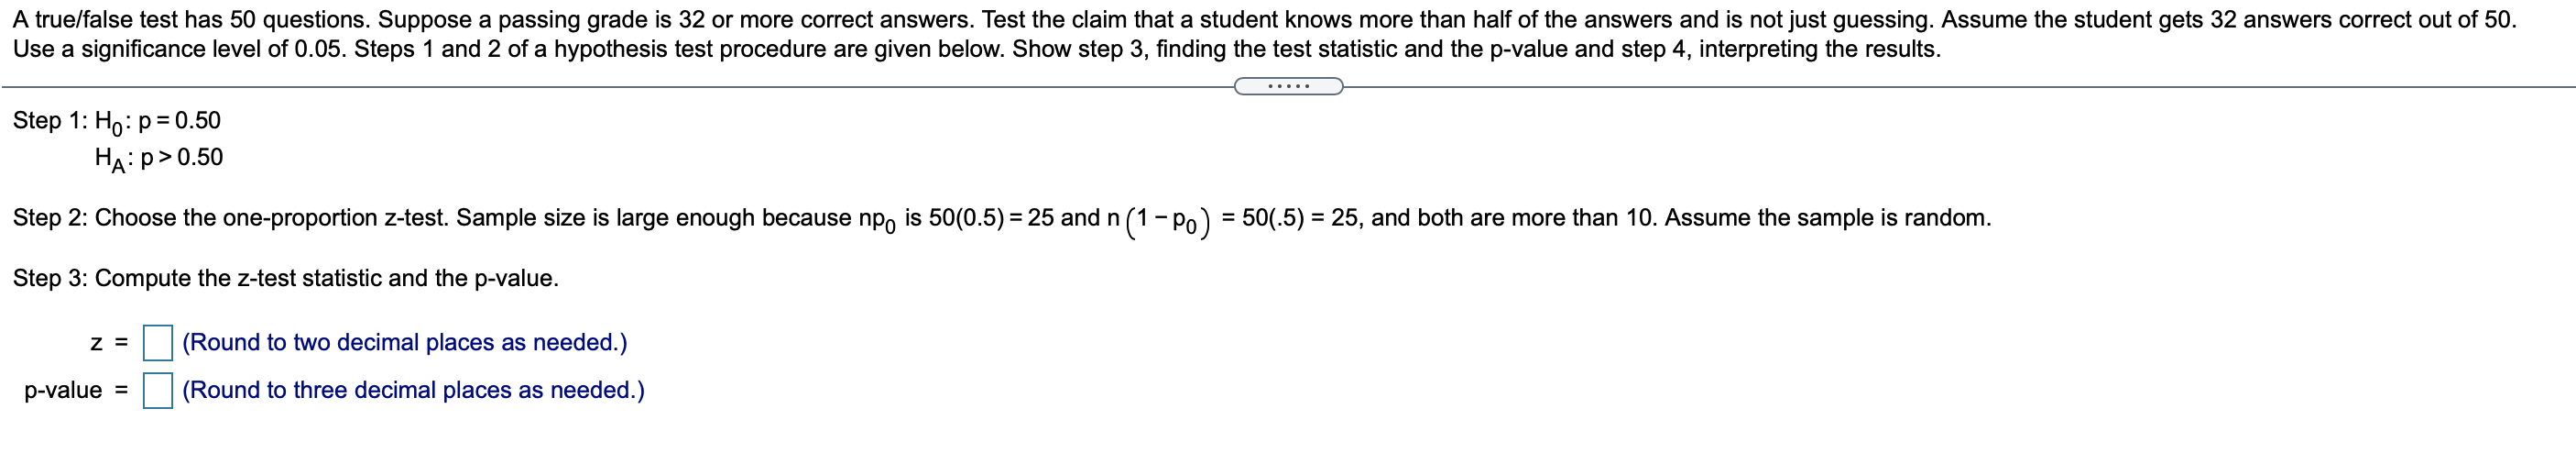
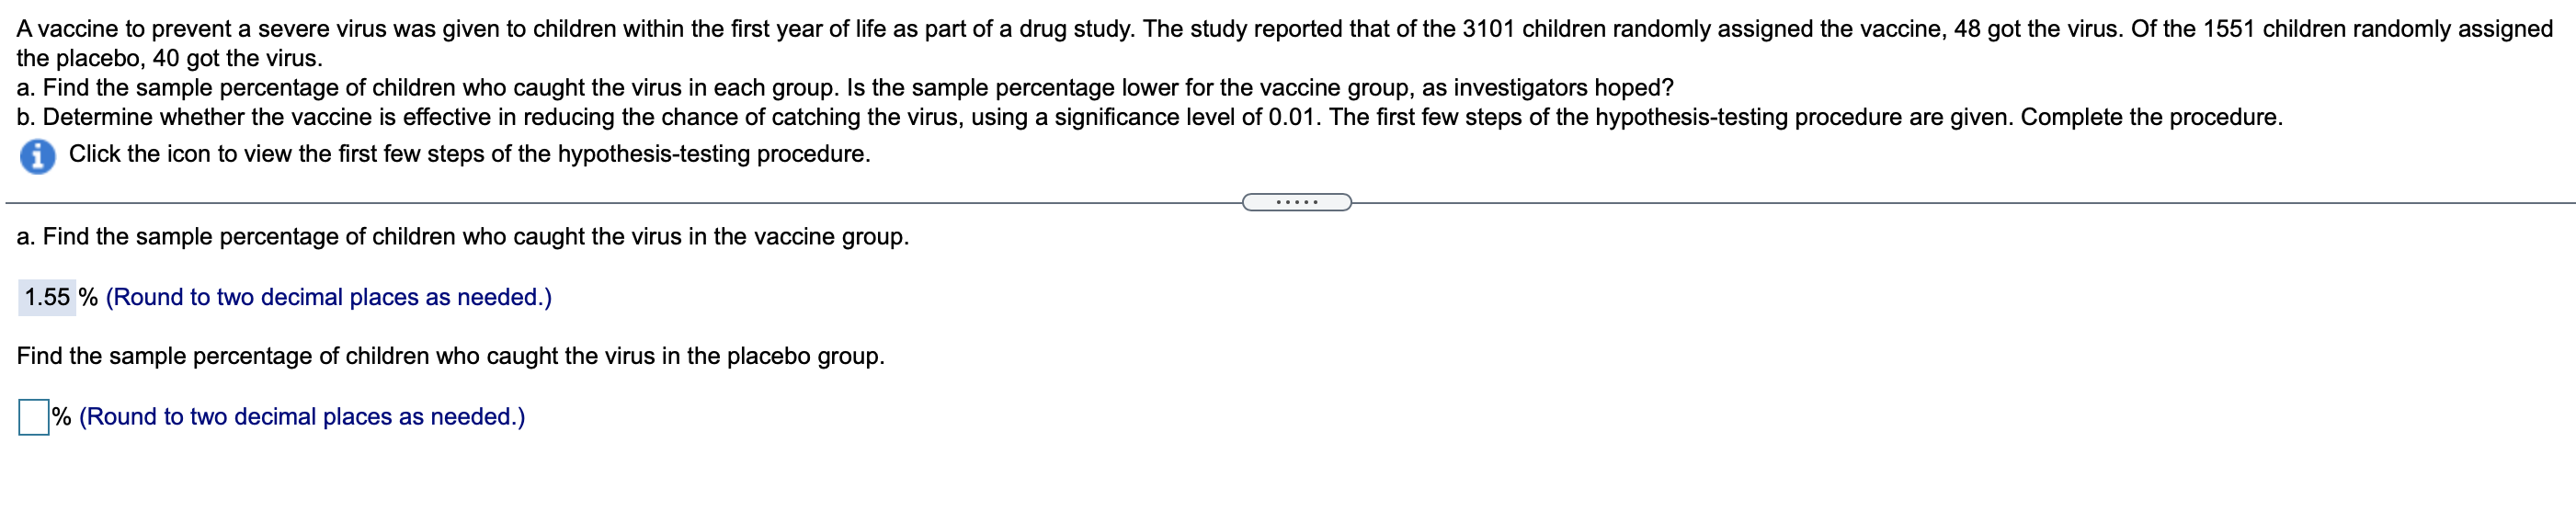
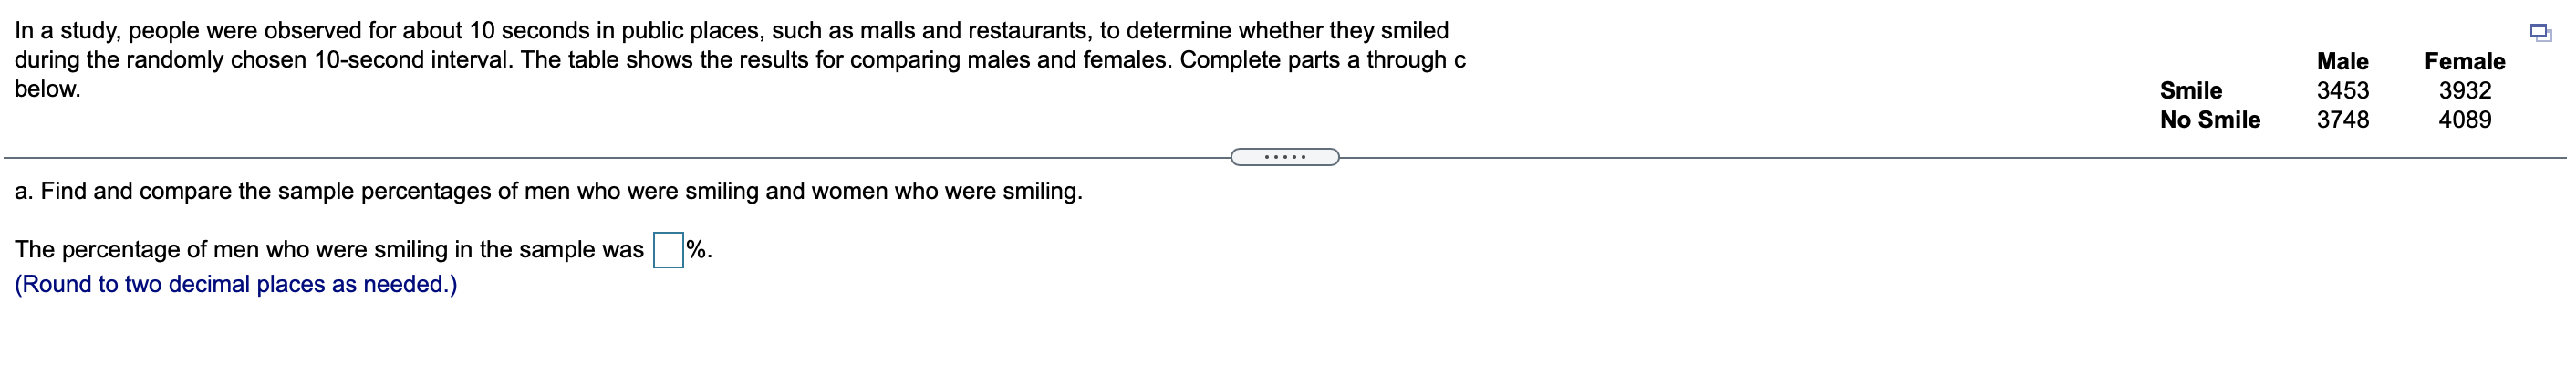
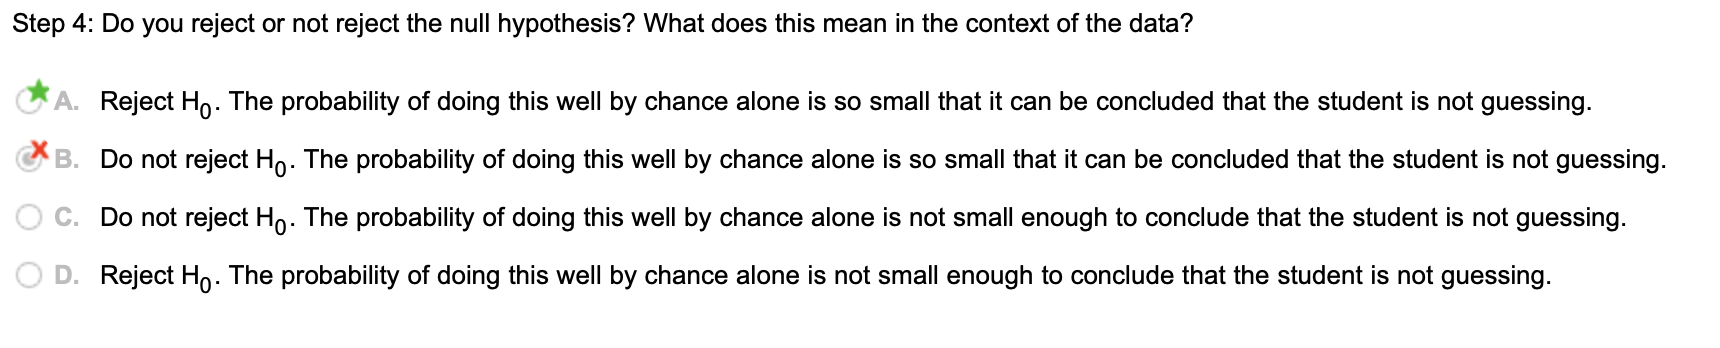
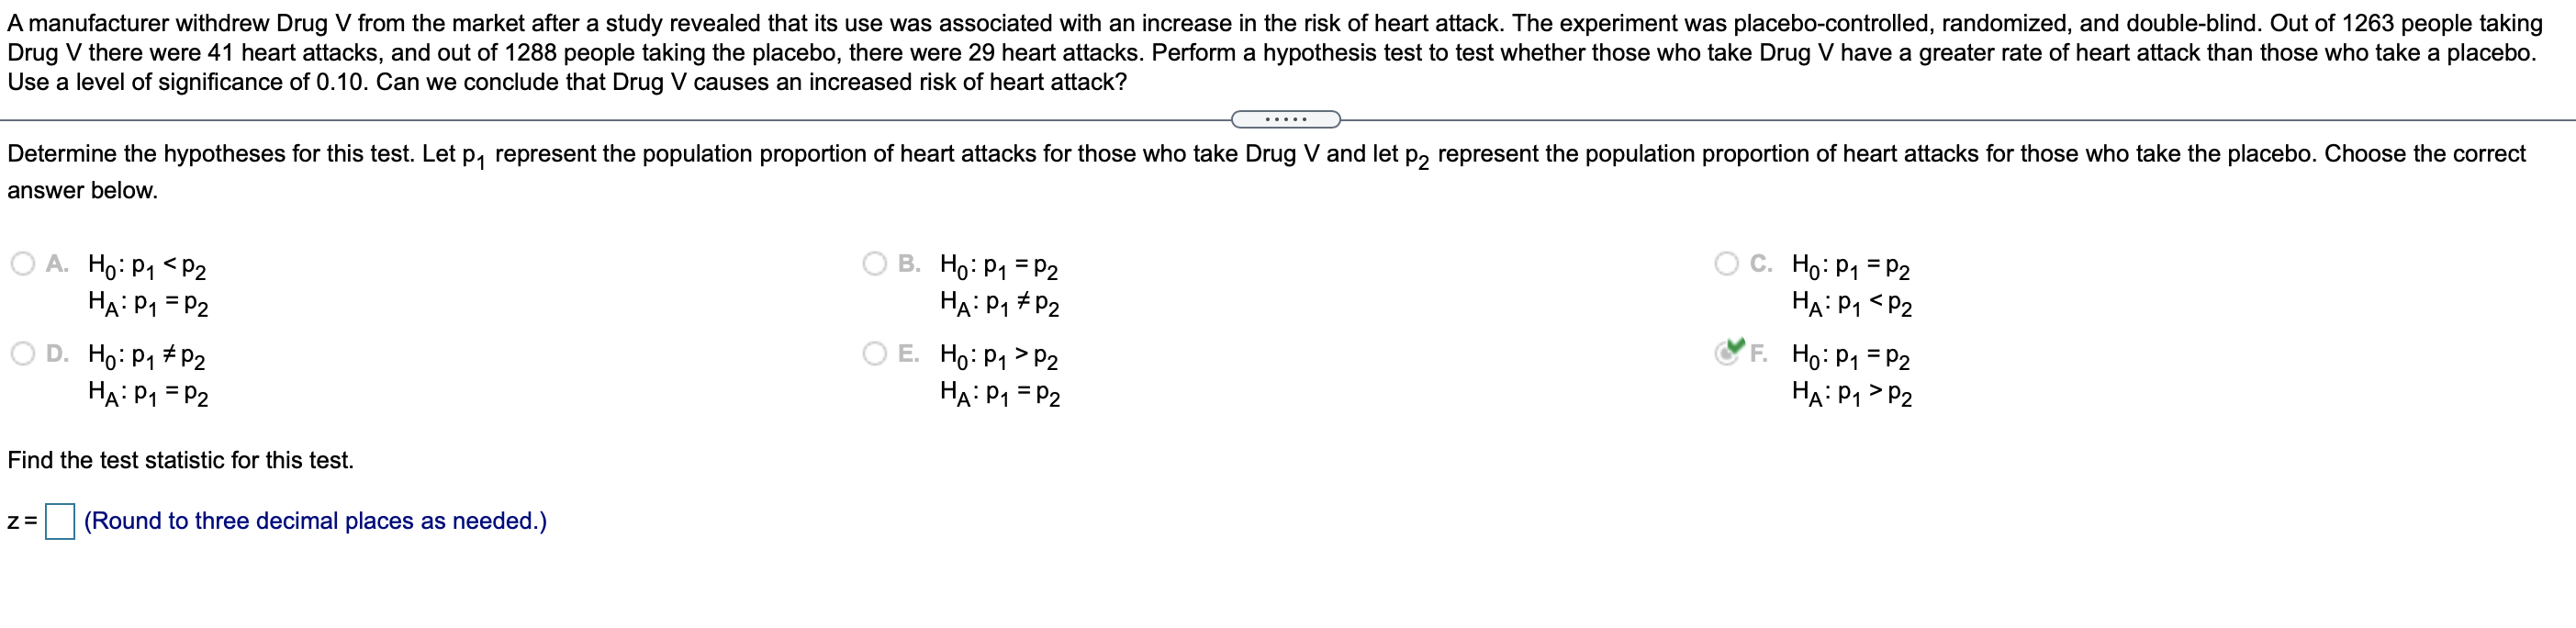
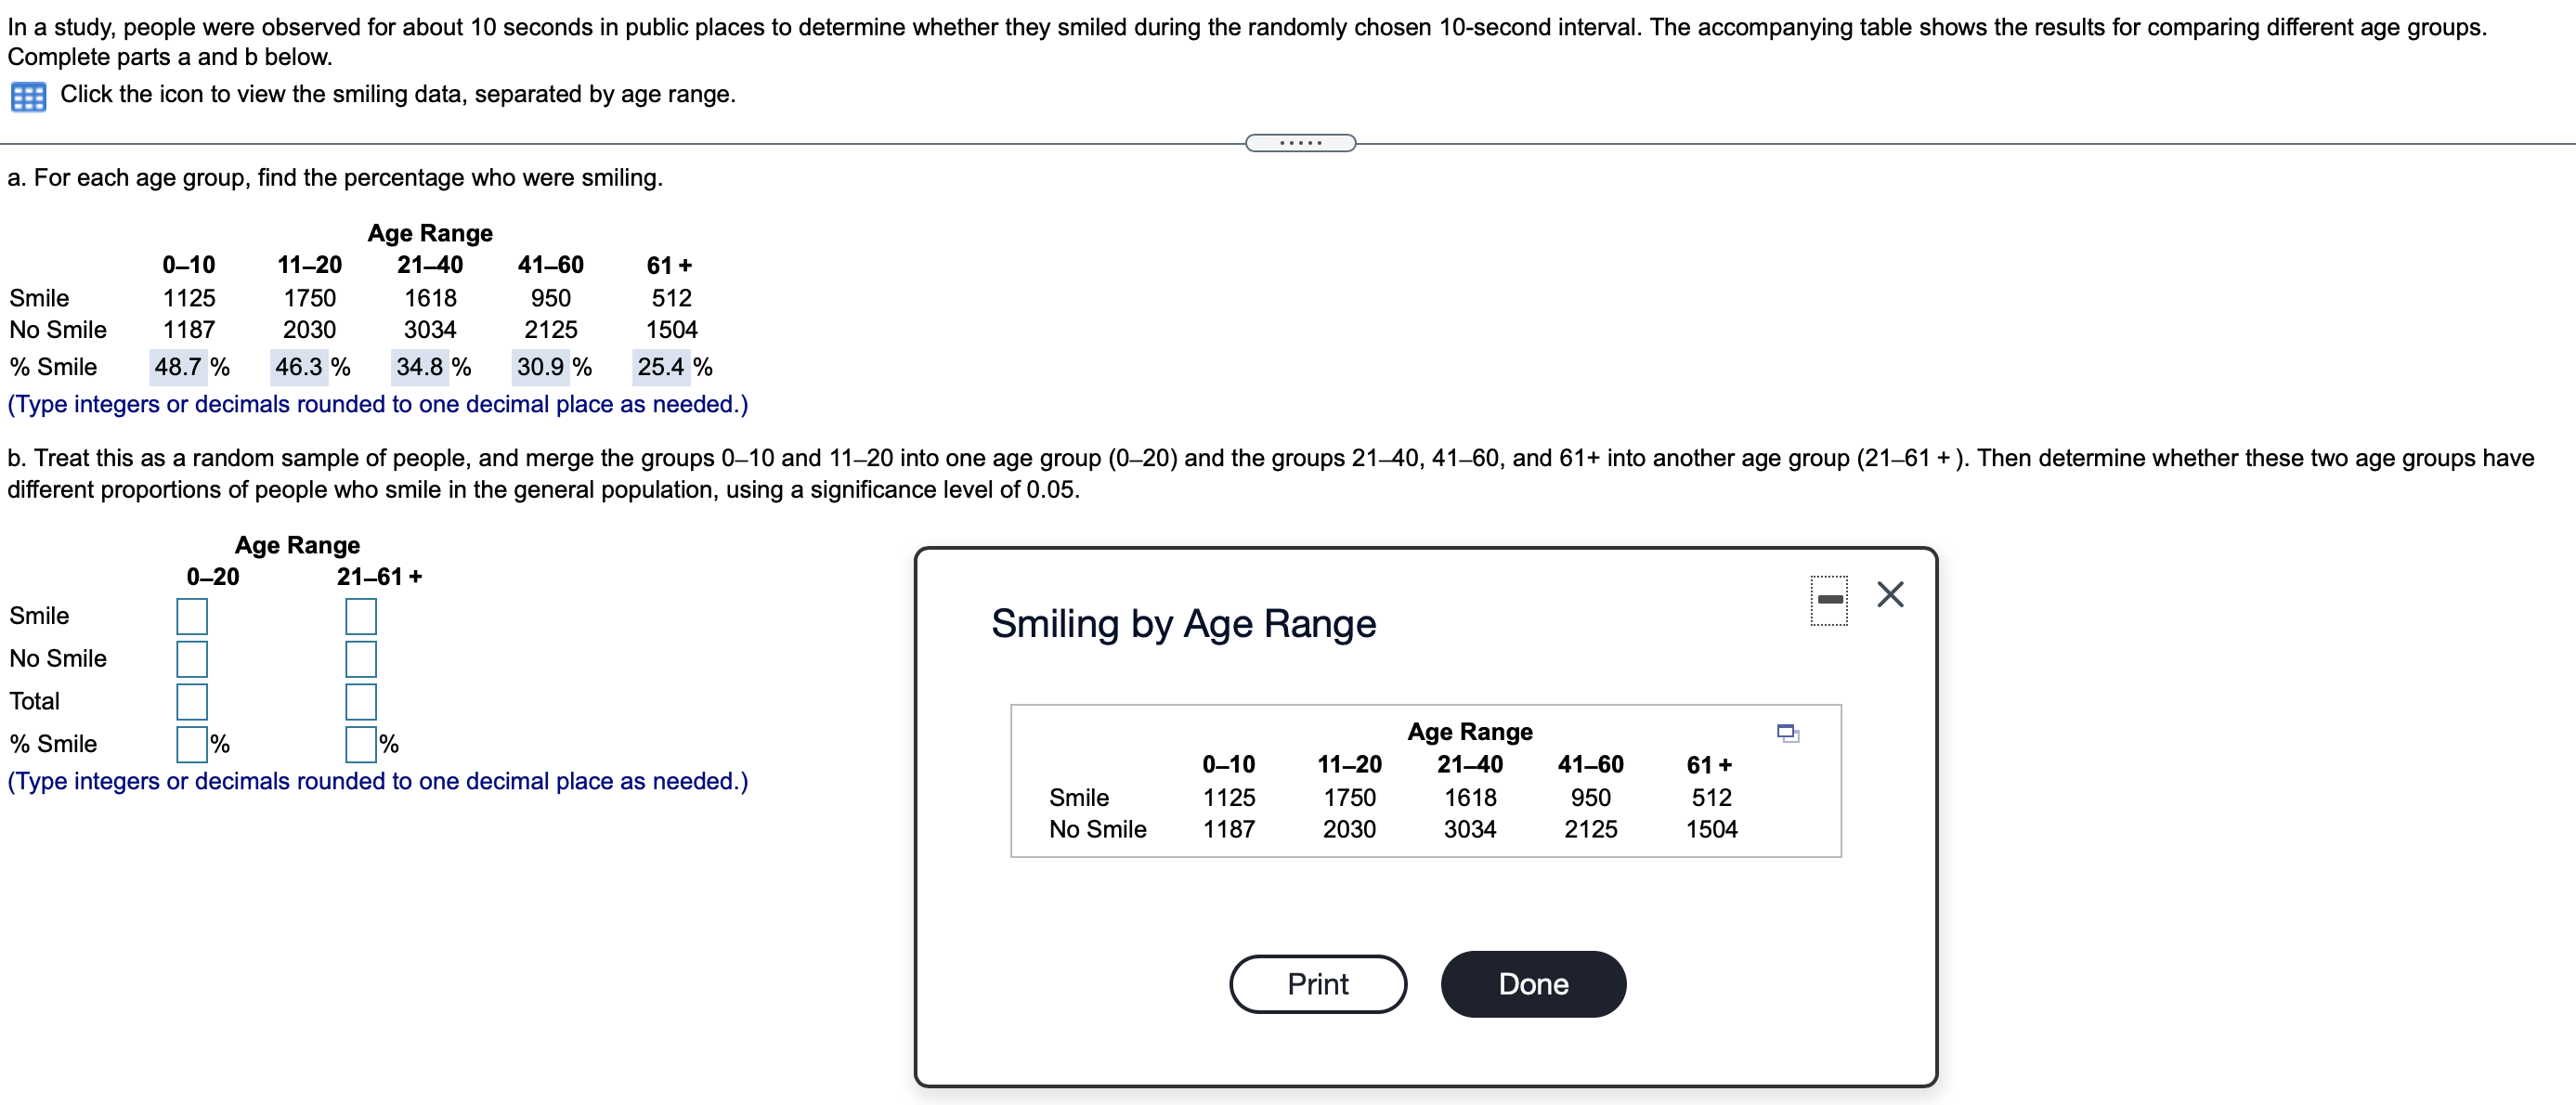
Step 4: Do you reject or not reject the null hypothesis? What does this mean in the context of the data? *A. Reject H0. The probability of doing this well by chance alone is so small that it can be concluded that the student is not guessing. 9' B. Do not reject H0. The probability of doing this well by chance alone is so small that it can be concluded that the student is not guessing. C. Do not reject H0. The probability of doing this well by chance alone is not small enough to conclude that the student is not guessing. D. Reject H0. The probability of doing this well by chance alone is not small enough to conclude that the student is not guessing. A true/false test has 50 questions. Suppose a passing grade is 32 or more correct answers. Test the claim that a student knows more than half of the answers and is not just guessing. Assume the student gets 32 answers correct out of 50. Use a signicance level of 0.05. Steps 1 and 2 of a hypothesis test procedure are given below. Show step 3, nding the test statistic and the p-value and step 4, interpreting the results. Step 1: Ho: p=0.50 HA:p>0.50 Step 2: Choose the oneproportion z-test. Sample size is large enough because npo is 50(0.5) = 25 and n (1 - p0) = 50(5) = 25, and both are more than 10. Assume the sample is random. Step 3: Compute the Z P2 HA : P1 > P2 OD. HO: P1 # P2 HA : P1 = P2 HA: P1 = P2 Find the test statistic for this test. z= (Round to three decimal places as needed.)A vaccine to prevent a severe virus was given to children within the first year of life as part of a drug study. The study reported that of the 3101 children randomly assigned the vaccine, 48 got the virus. Of the 1551 children randomly assigned the placebo, 40 got the virus. a. Find the sample percentage of children who caught the virus in each group. Is the sample percentage lower for the vaccine group, as investigators hoped? b. Determine whether the vaccine is effective in reducing the chance of catching the virus, using a significance level of 0.01. The first few steps of the hypothesis-testing procedure are given. Complete the procedure. i Click the icon to view the first few steps of the hypothesis-testing procedure. . . . . a. Find the sample percentage of children who caught the virus in the vaccine group. 1.55 % (Round to two decimal places as needed.) Find the sample percentage of children who caught the virus in the placebo group. % (Round to two decimal places as needed.)Q1 In a study, people were observed for about 10 seconds in public places, such as malls and restaurants, to determine whether they smiled during the randomly chosen 10-second interval. The table shows the results for comparing males and females. Complete parts a through 0 Male Female below. Smile 3453 3932 No Smile 3748 4089 a. Find and oompare the sample percentages of men who were smiling and women who were smiling. The peroentage of men who were smiling in the sample was %. (Round to two decimal places as needed.) In a study, people were observed for about 10 seconds in public places to determine whether they smiled during the randomly chosen 10-second interval. The accompanying table shows the results for comparing different age groups. Complete parts a and b below. Click the icon to view the smiling data, separated by age range. . . . . . a. For each age group, find the percentage who were smiling. Age Range 0-10 11-20 21-40 41-60 61+ Smile 1125 1750 1618 950 512 No Smile 1187 2030 3034 2125 1504 % Smile 48.7 % 46.3 % 34.8 % 30.9 % 25.4 % (Type integers or decimals rounded to one decimal place as needed.) b. Treat this as a random sample of people, and merge the groups 0-10 and 11-20 into one age group (0-20) and the groups 21-40, 41-60, and 61+ into another age group (21-61 + ). Then determine whether these two age groups have different proportions of people who smile in the general population, using a significance level of 0.05. Age Range 0-20 21-61+ X Smile Smiling by Age Range No Smile Total Age Range % Smile 0-10 11-20 21-40 41-60 61+ (Type integers or decimals rounded to one decimal place as needed.) Smile 1125 1750 1618 950 512 No Smile 1187 2030 3034 2125 1504 Print Done
Step by Step Solution
There are 3 Steps involved in it
1 Expert Approved Answer
Step: 1 Unlock
Question Has Been Solved by an Expert!
Get step-by-step solutions from verified subject matter experts
Step: 2 Unlock
Step: 3 Unlock
Students Have Also Explored These Related Mathematics Questions!