

Question: 5. Step 1: Fill in the blank. The table below displays the average price per ounce of gold in the given year. 2005 2007 2009
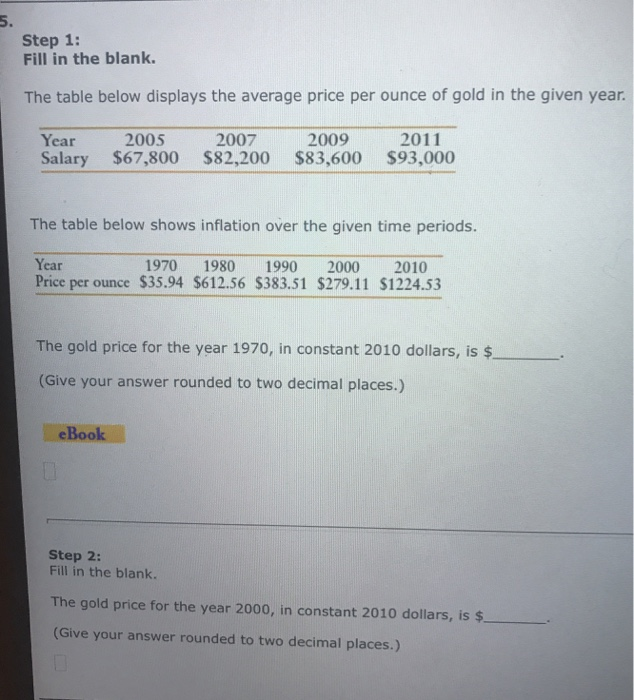
5. Step 1: Fill in the blank. The table below displays the average price per ounce of gold in the given year. 2005 2007 2009 2011 Year Salary $67,800 $82,200 $83,600 $93,000 The table below shows inflation over the given time periods. Year Price per ounce $35.94 $612.56 $383.51 $279.11 S1224.53 1970 1980 1990 2000 2010 The gold price for the year 1970, in constant 2010 dollars, is $ (Give your answer rounded to two decimal places.) eBook Step 2: Fill in the blank. The gold price for the year 2000, in constant 2010 dollars, is $ (Give your answer rounded to two decimal places.) 5. Step 1: Fill in the blank. The table below displays the average price per ounce of gold in the given year. 2005 2007 2009 2011 Year Salary $67,800 $82,200 $83,600 $93,000 The table below shows inflation over the given time periods. Year Price per ounce $35.94 $612.56 $383.51 $279.11 S1224.53 1970 1980 1990 2000 2010 The gold price for the year 1970, in constant 2010 dollars, is $ (Give your answer rounded to two decimal places.) eBook Step 2: Fill in the blank. The gold price for the year 2000, in constant 2010 dollars, is $ (Give your answer rounded to two decimal places.)
Step by Step Solution
There are 3 Steps involved in it

Get step-by-step solutions from verified subject matter experts