

Question: 5. The figure below shows the ACFs for 36 random numbers, 360 random numbers and 1,000 random numbers. Explain the differences among these figures. Do
5. The figure below shows the ACFs for 36 random numbers, 360 random numbers and 1,000 random numbers.
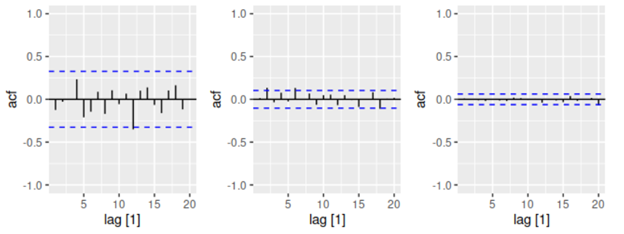
Explain the differences among these figures. Do they all indicate that the data are white noise?
1.0- 1.0- 1.0- 0.5 - 0.5- 0.5- 0.0 4 500=12E 300 == -0.5 - -0.5 - -0.5 - -1.0 - -1.0 - -1.0 - UN- 20 20 15 20 10 15 lag (1) 10 15 lag (1) 10 lag (1) 1.0- 1.0- 1.0- 0.5 - 0.5- 0.5- 0.0 4 500=12E 300 == -0.5 - -0.5 - -0.5 - -1.0 - -1.0 - -1.0 - UN- 20 20 15 20 10 15 lag (1) 10 15 lag (1) 10 lag (1)
Step by Step Solution
There are 3 Steps involved in it
1 Expert Approved Answer
Step: 1 Unlock

Question Has Been Solved by an Expert!
Get step-by-step solutions from verified subject matter experts
Step: 2 Unlock
Step: 3 Unlock