

Question: 5. The following analyses are based on a dataset with 4 variables, Y, X1, X2 and X3. Note C(P) is a measure of bias
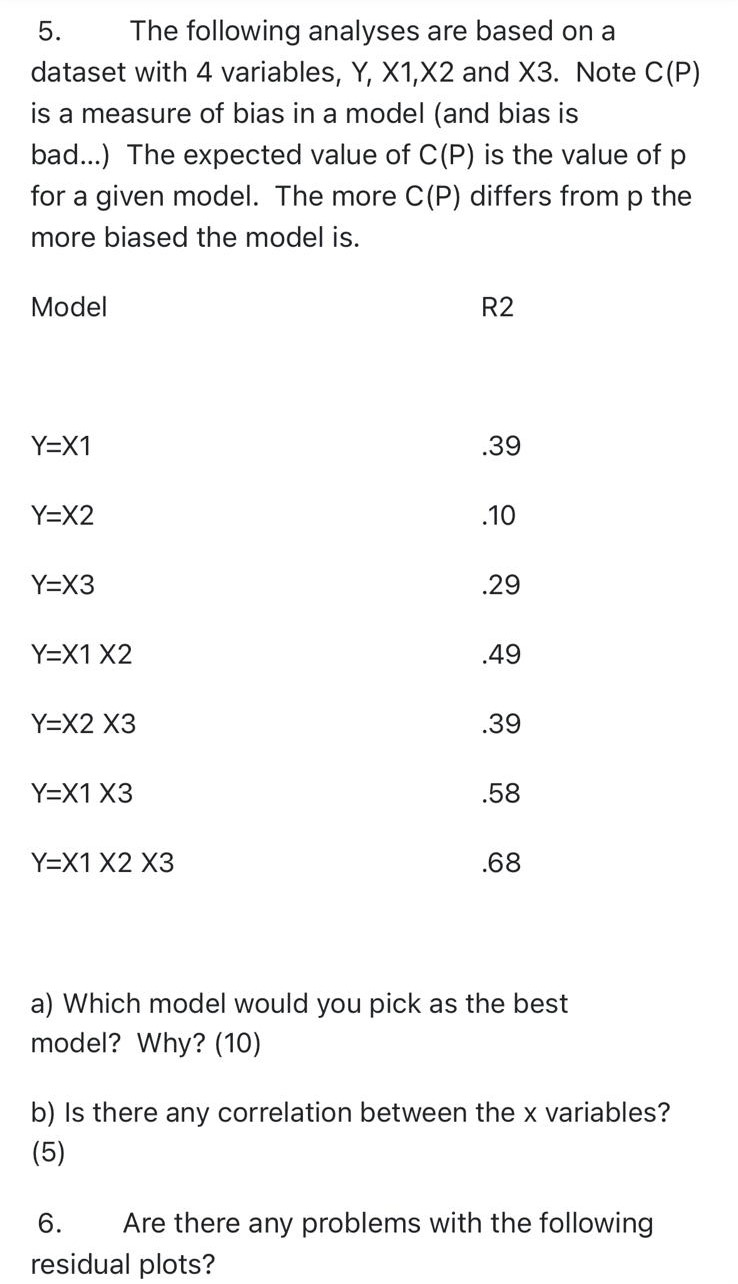
5. The following analyses are based on a dataset with 4 variables, Y, X1, X2 and X3. Note C(P) is a measure of bias in a model (and bias is bad...) The expected value of C(P) is the value of p for a given model. The more C(P) differs from p the more biased the model is. Model R2 22 Y=X1 .39 Y=X2 .10 Y=X3 .29 Y=X1 X2 .49 Y=X2 X3 .39 Y=X1 X3 .58 Y=X1 X2 X3 .68 a) Which model would you pick as the best model? Why? (10) b) Is there any correlation between the x variables? (5) 6. Are there any problems with the following residual plots?
Step by Step Solution
There are 3 Steps involved in it
1 Expert Approved Answer
Step: 1 Unlock

Question Has Been Solved by an Expert!
Get step-by-step solutions from verified subject matter experts
Step: 2 Unlock
Step: 3 Unlock