

Question: 5. The following is a sample data set showing the price on redfin (in thousands of dollars) of eight randomly selected homes in Bellingham on
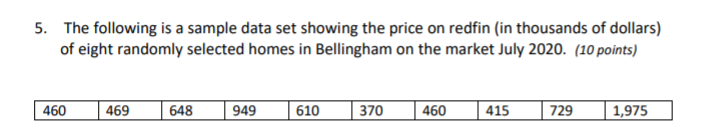
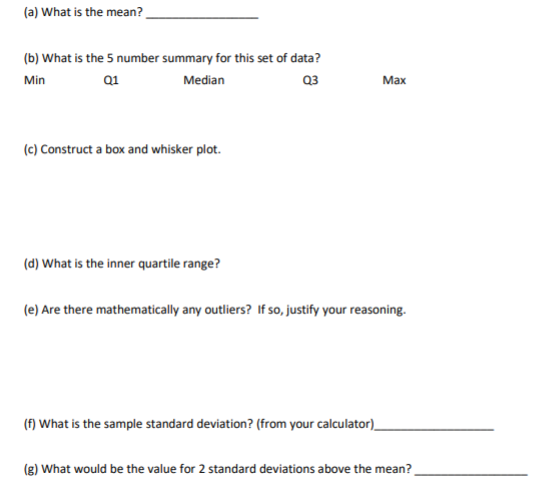
5. The following is a sample data set showing the price on redfin (in thousands of dollars) of eight randomly selected homes in Bellingham on the market July 2020. (10 points) 460 469 648 949 610 370 460 415 729 1,975(a) What is the mean? (b) What is the 5 number summary for this set of data? Min Q1 Median Q3 Max (c) Construct a box and whisker plot. (d) What is the inner quartile range? (e) Are there mathematically any outliers? If so, justify your reasoning. (f) What is the sample standard deviation? (from your calculator), (g) What would be the value for 2 standard deviations above the mean
Step by Step Solution
There are 3 Steps involved in it
1 Expert Approved Answer
Step: 1 Unlock

Question Has Been Solved by an Expert!
Get step-by-step solutions from verified subject matter experts
Step: 2 Unlock
Step: 3 Unlock