

Question: 5. The graph below illustrates the effects on the population of an animal species beginning with colonization and ending with the establishment of itself within
5. The graph below illustrates the effects on the population of an animal species beginning with colonization and ending with the establishment of itself within the ecosystem. Identify three factors that affect the shape of the curve. Explain the effects of these factors throughout the entire time period. (6 points) 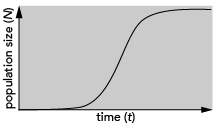
time (t) population size (N)
Step by Step Solution
★★★★★
3.40 Rating (169 Votes )
There are 3 Steps involved in it
1 Expert Approved Answer
Step: 1 Unlock

The graph depicts an Sshaped or logistic growth curve illustrating how an animal population grows ov... View full answer
Question Has Been Solved by an Expert!
Get step-by-step solutions from verified subject matter experts
Step: 2 Unlock
Step: 3 Unlock