

Question: 5) The graph below is the yield chart of 5 year German Government Bond in Euros. As it is seen from the chart; 5 year
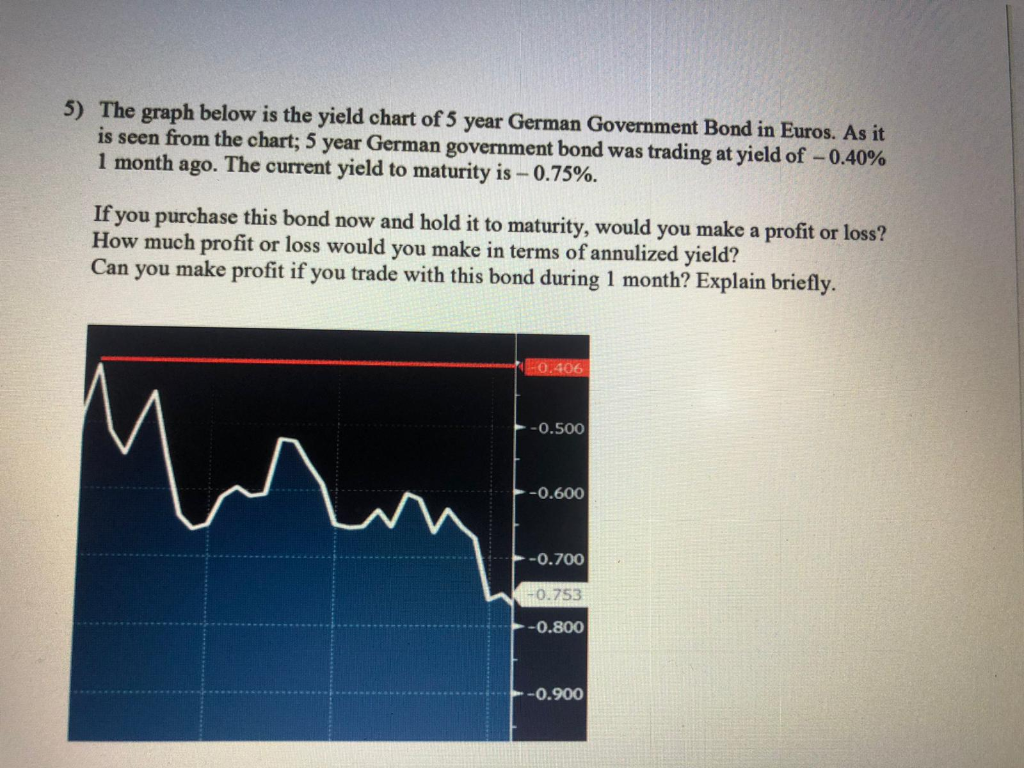
5) The graph below is the yield chart of 5 year German Government Bond in Euros. As it is seen from the chart; 5 year German government bond was trading at yield of -0.40% 1 month ago. The current yield to maturity is - 0.75%. If you purchase this bond now and hold it to maturity, would you make a profit or loss? How much profit or loss would you make in terms of annulized yield? Can you make profit if you trade with this bond during 1 month? Explain briefly. -0.406 .-0.500 -0.600 -0.700 1-0.753 -0.800 -0.900
Step by Step Solution
There are 3 Steps involved in it
1 Expert Approved Answer
Step: 1 Unlock

Question Has Been Solved by an Expert!
Get step-by-step solutions from verified subject matter experts
Step: 2 Unlock
Step: 3 Unlock