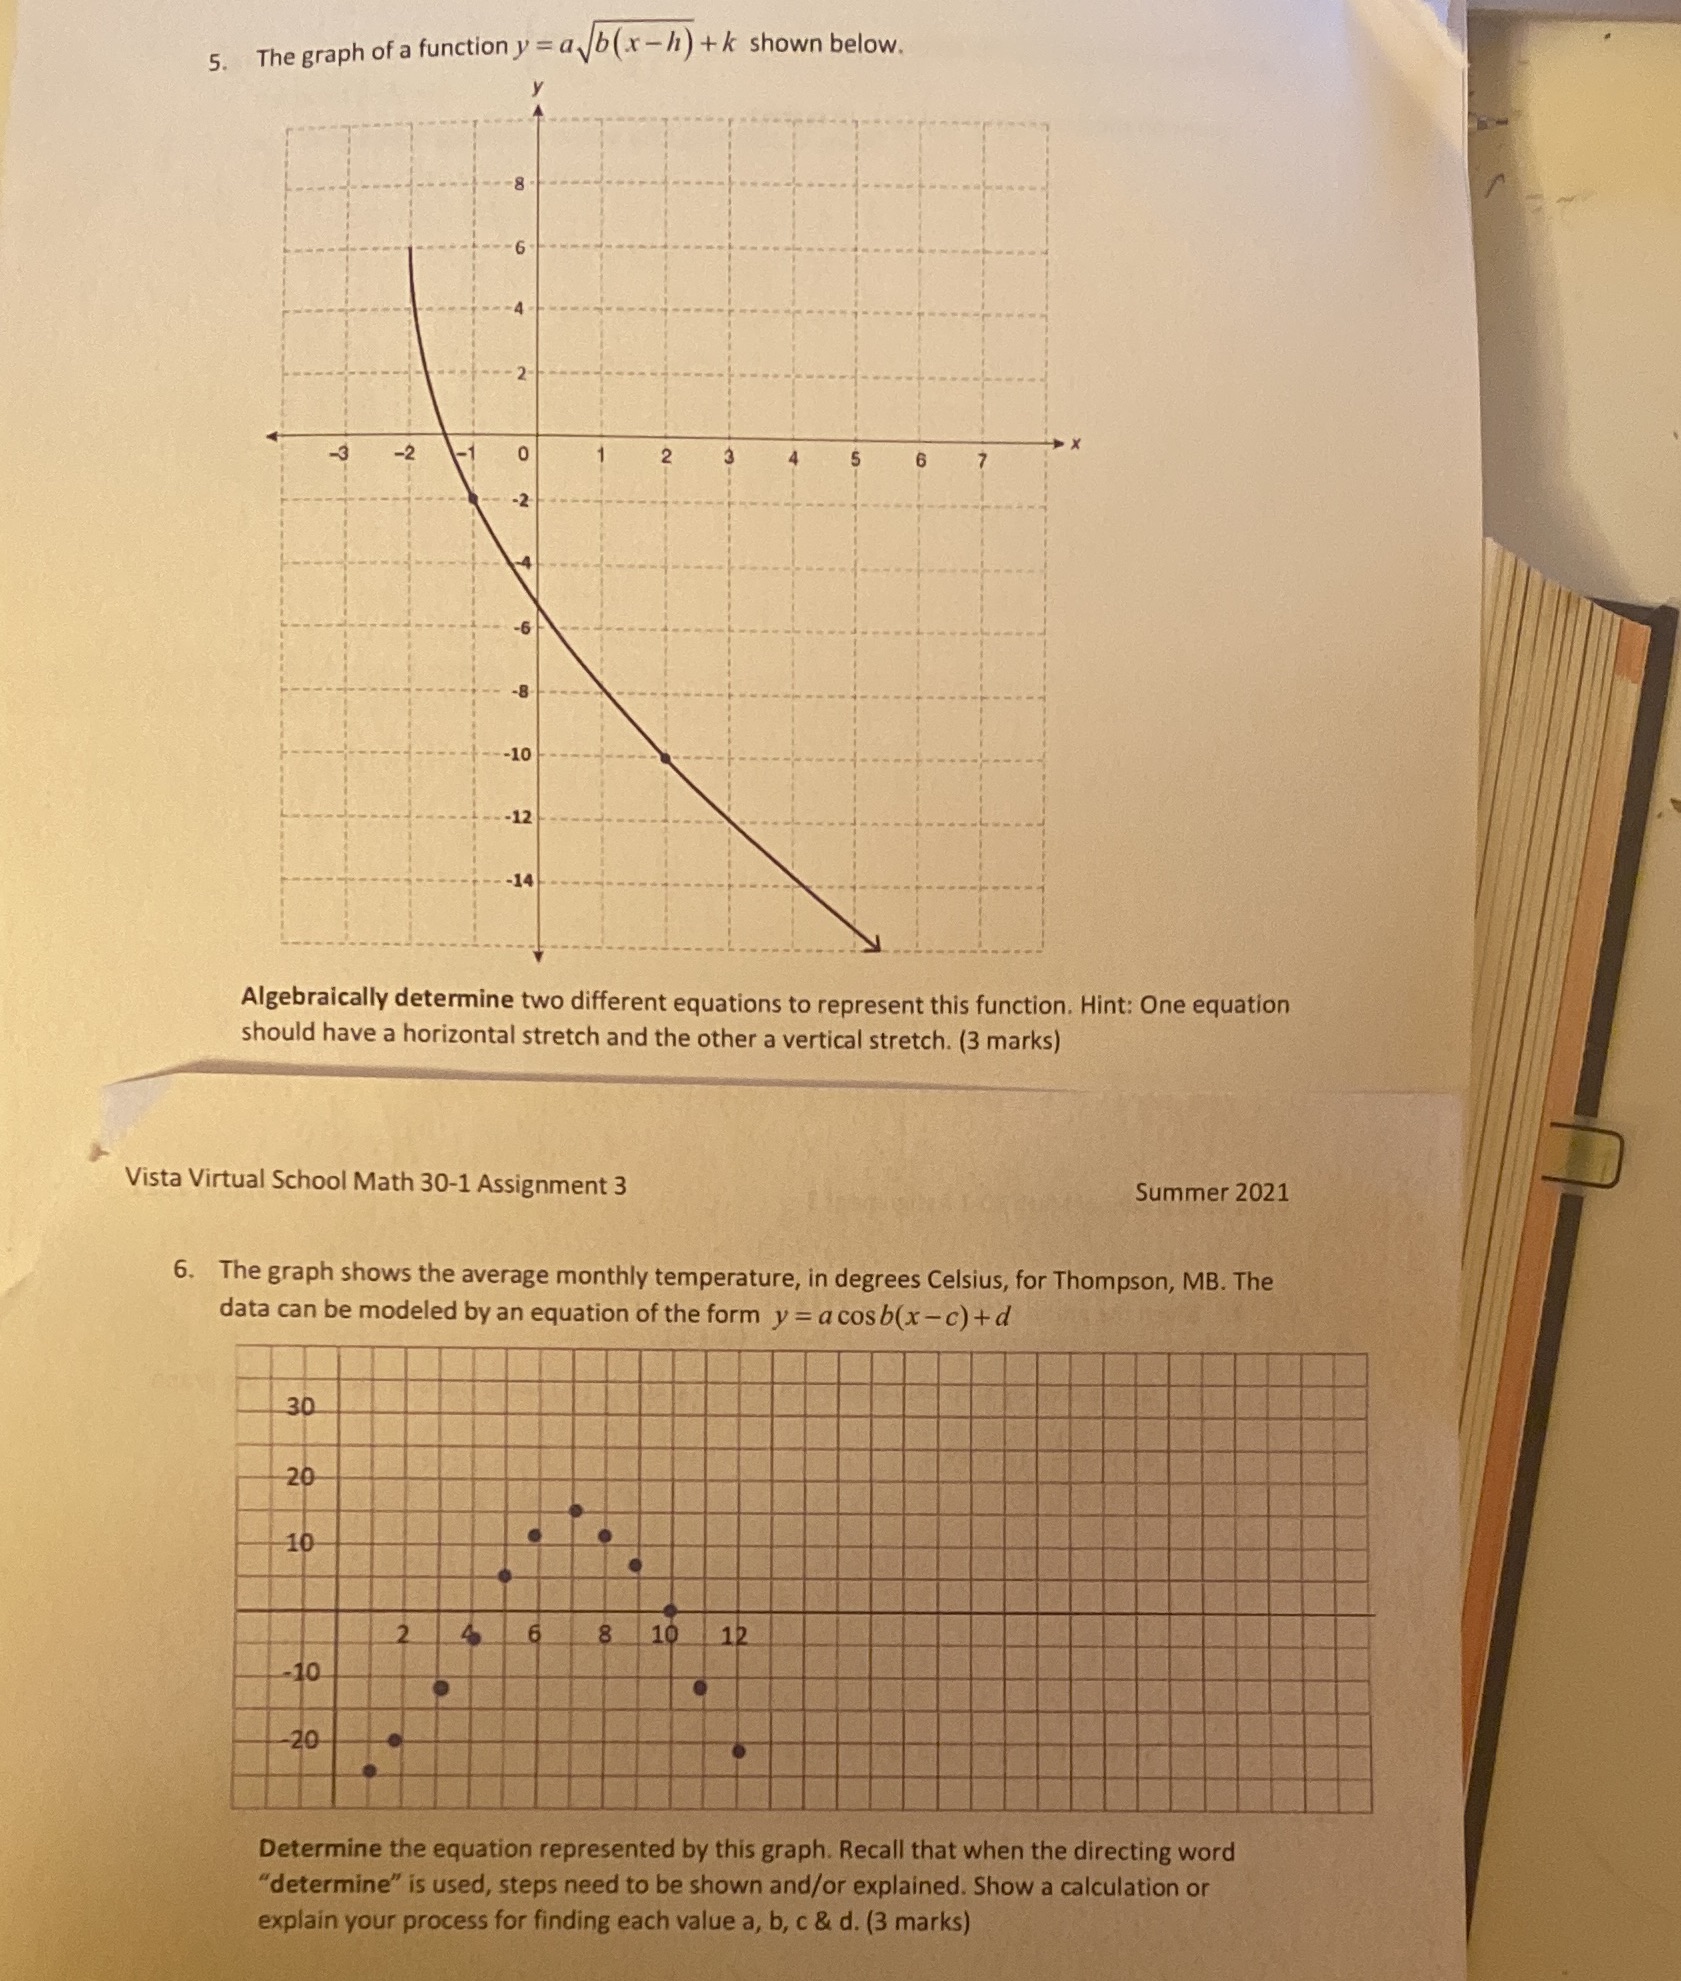
Question: 5. The graph of a function y = a b(x - h) + k shown below. -10 -12 -14 Algebraically determine two different equations to

5. The graph of a function y = a b(x - h) + k
5. The graph of a function y = a b(x - h) + k shown below. -10 -12 -14 Algebraically determine two different equations to represent this function. Hint: One equation should have a horizontal stretch and the other a vertical stretch. (3 marks) Vista Virtual School Math 30-1 Assignment 3 Summer 2021 6. The graph shows the average monthly temperature, in degrees Celsius, for Thompson, MB. The data can be modeled by an equation of the form y = a cosb(x -c) +d 30 20 10 8 10 12 10 20 Determine the equation represented by this graph. Recall that when the directing word "determine" is used, steps need to be shown and/or explained. Show a calculation or explain your process for finding each value a, b, c & d

Step by Step Solution

There are 3 Steps involved in it

1 Expert Approved Answer
Step: 1 Unlock blur-text-image
Question Has Been Solved by an Expert!

Get step-by-step solutions from verified subject matter experts

Step: 2 Unlock
Step: 3 Unlock

Students Have Also Explored These Related Mathematics Questions!