

Question: 5 The table below shows the aggregate demand for the economy of Itera. Its potential GDP (LAS) Is $850. Price Index Aggregate Quantity Demanded 850
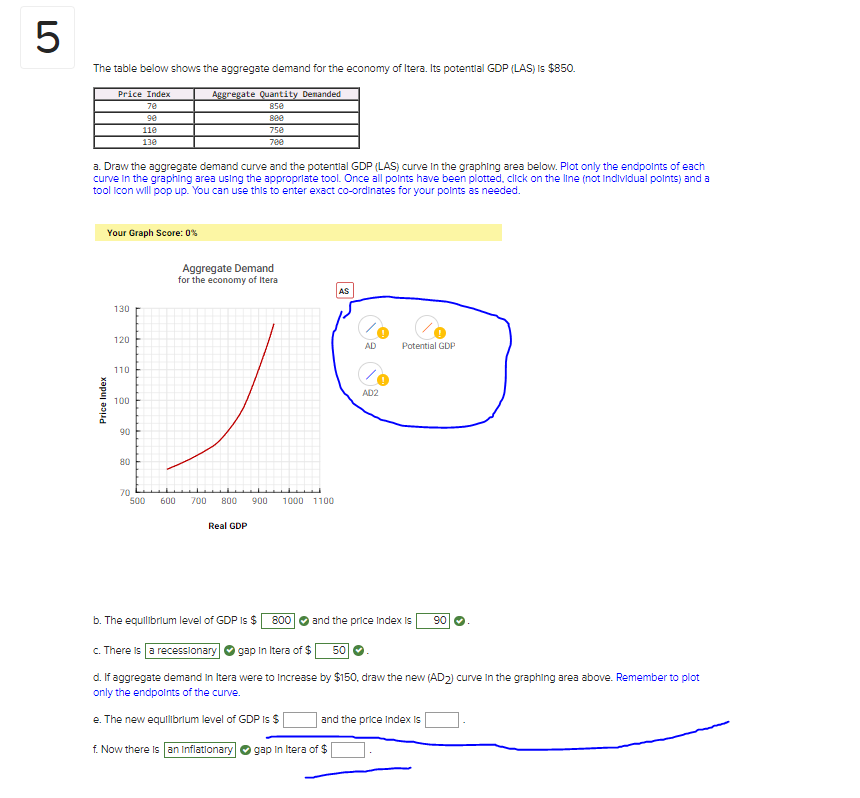

5 The table below shows the aggregate demand for the economy of Itera. Its potential GDP (LAS) Is $850. Price Index Aggregate Quantity Demanded 850 118 750 138 a. Draw the aggregate demand curve and the potential GDP (LAS) curve In the graphing area below. Plot only the endpoints of each curve In the graphing area using the appropriate tool. Once all points have been plotted, click on the line (not Individual points) and a tool icon will pop up. You can use this to enter exact co-ordinates for your points as needed. Your Graph Score: 0% Aggregate Demand for the economy of Itera AS 130 120 AD Potential GDP 110 AD2 Price Index 00 500 600 700 800 1000 1100 Real GDP b. The equilibrium level of GDP Is $ |800 O and the price Index Is 90 c. There is a recessionary @ gap In Itera of $ |50 0 d. If aggregate demand in Itera were to Increase by $150, draw the new (AD2) curve In the graphing area above. Remember to plot only the endpoints of the curve. e. The new equilibrium level of GDP Is $ and the price Index Is f. Now there is an Inflationary @ gap In Itera of $
Step by Step Solution
There are 3 Steps involved in it

Get step-by-step solutions from verified subject matter experts