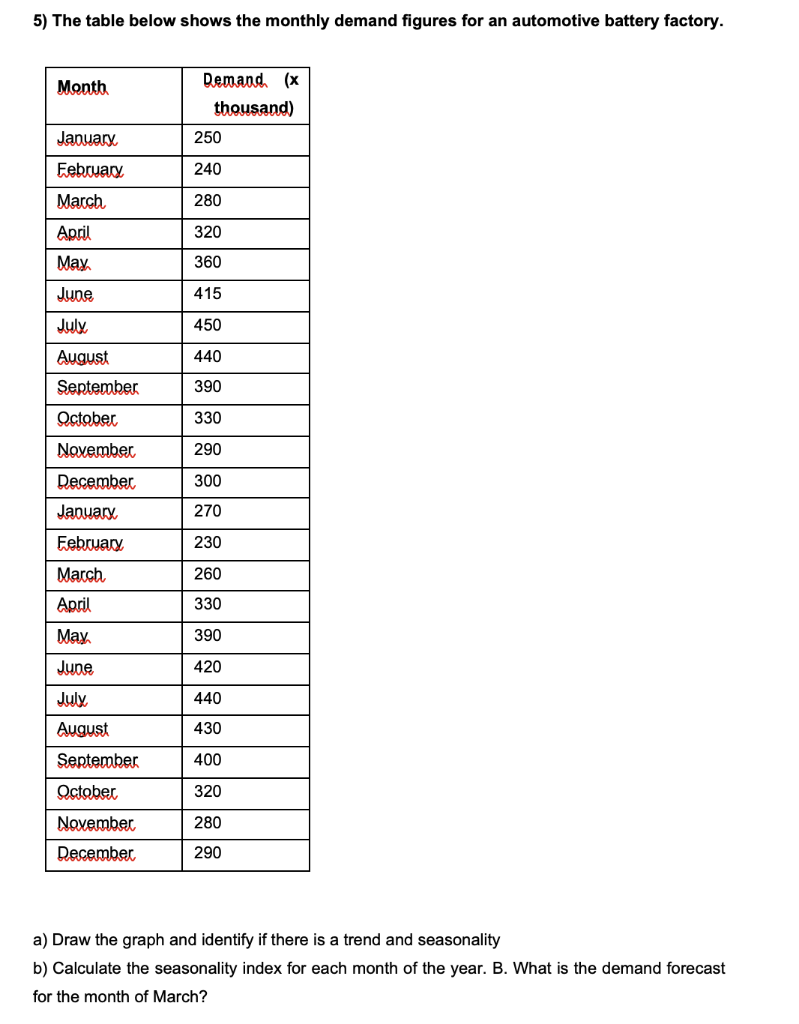
Question: 5) The table below shows the monthly demand figures for an automotive battery factory. Month Demand. (x thousand) 250 240 280 January February March April

5) The table below shows the monthly demand

5) The table below shows the monthly demand figures for an automotive battery factory. Month Demand. (x thousand) 250 240 280 January February March April May June 320 360 415 July 450 440 August September 390 330 October November 290 300 December January 270 230 February March 260 330 April May 390 June 420 440 August 430 September 400 October 320 November 280 December 290 a) Draw the graph and identify if there is a trend and seasonality b) Calculate the seasonality index for each month of the year. B. What is the demand forecast for the month of March

Step by Step Solution

There are 3 Steps involved in it

1 Expert Approved Answer
Step: 1 Unlock blur-text-image
Question Has Been Solved by an Expert!

Get step-by-step solutions from verified subject matter experts

Step: 2 Unlock
Step: 3 Unlock

Students Have Also Explored These Related General Management Questions!