

Question: 5. The table below shows the relationship between the number of minutes of DOWNTIME pay (dependant variable] and the number of units of PRODUCTION per
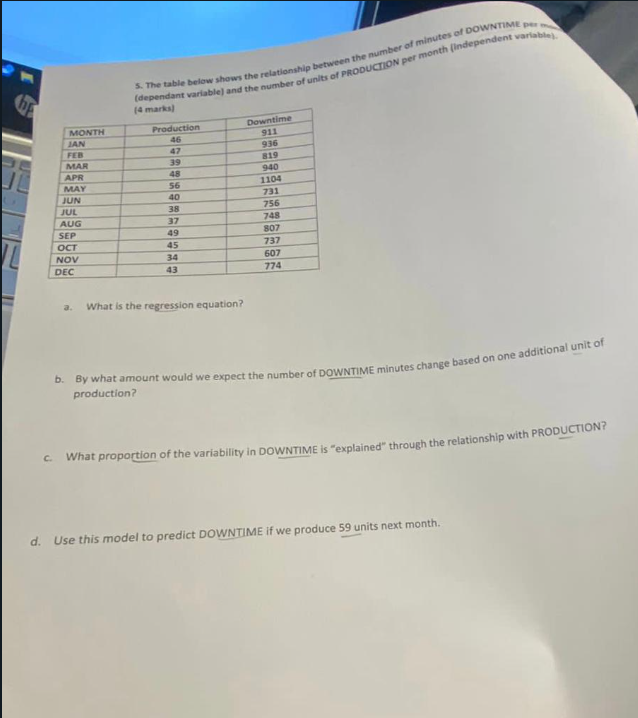
5. The table below shows the relationship between the number of minutes of DOWNTIME pay (dependant variable] and the number of units of PRODUCTION per month (independent vartan 14 marks MONTH Production Downtime JAN 911 FEB 47 936 MAR GE 819 APR 48 940 MAY 56 1104 JUN 40 791 JUL 38 756 AUG 37 748 SEP 49 507 OCT 45 737 NOV 34 607 DEC 43 774 a. What is the regression equation? b. By what amount would we expect the number of DOWNTIME minutes change based on one additional unit of production? c. What proportion of the variability in DOWNTIME is "explained" through the relationship with PRODUCTION? d. Use this model to predict DOWNTIME if we produce 59 units next month
Step by Step Solution
There are 3 Steps involved in it

Get step-by-step solutions from verified subject matter experts