

Question: 5. The table shows the maximum temperatures in 15 cities in Ontario one day in June. a) Is this a sample or population? Why? b)
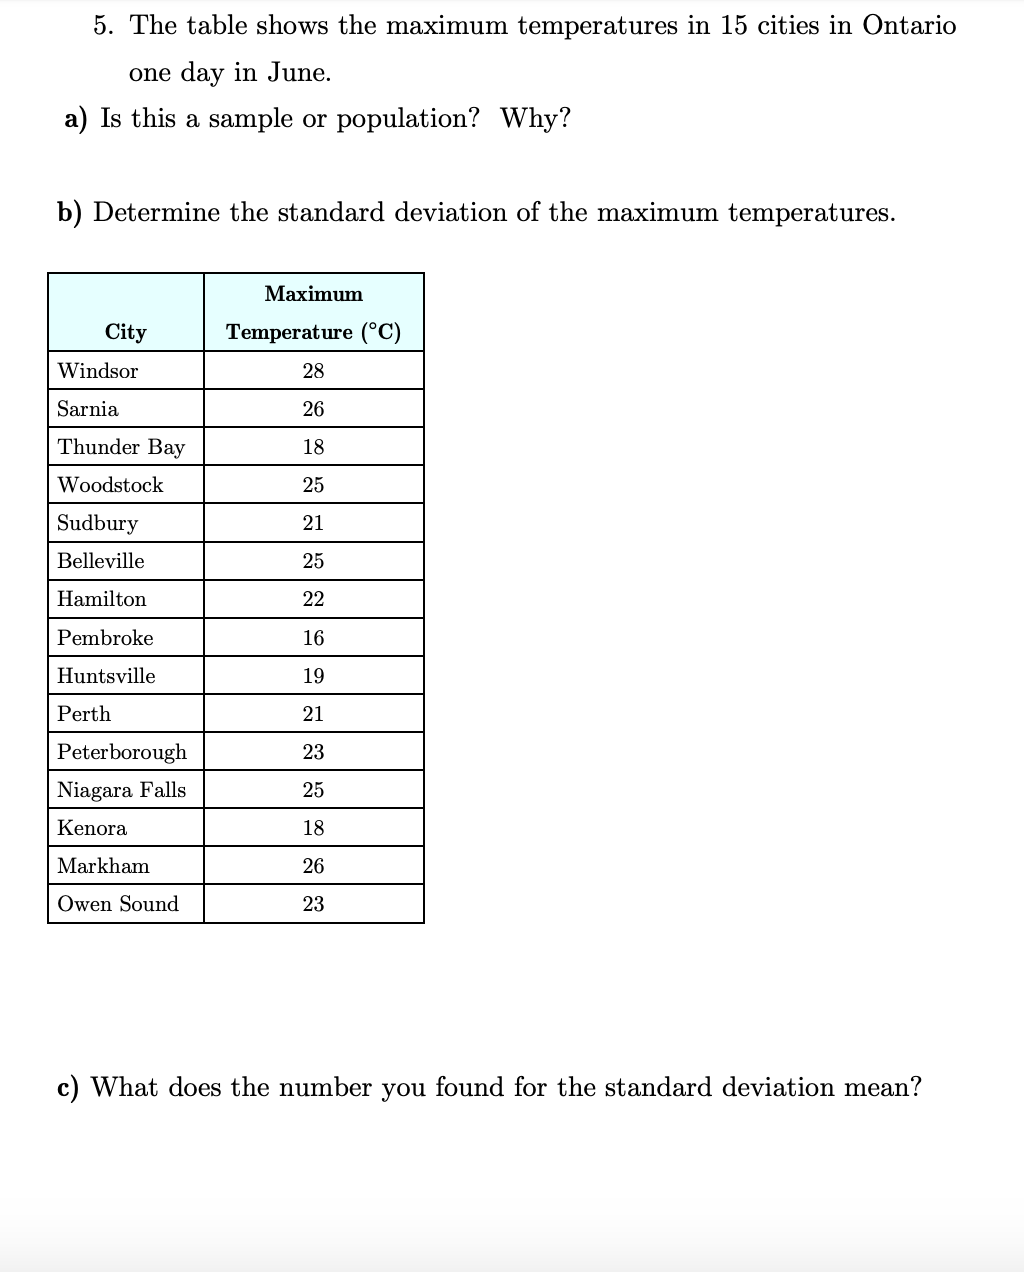
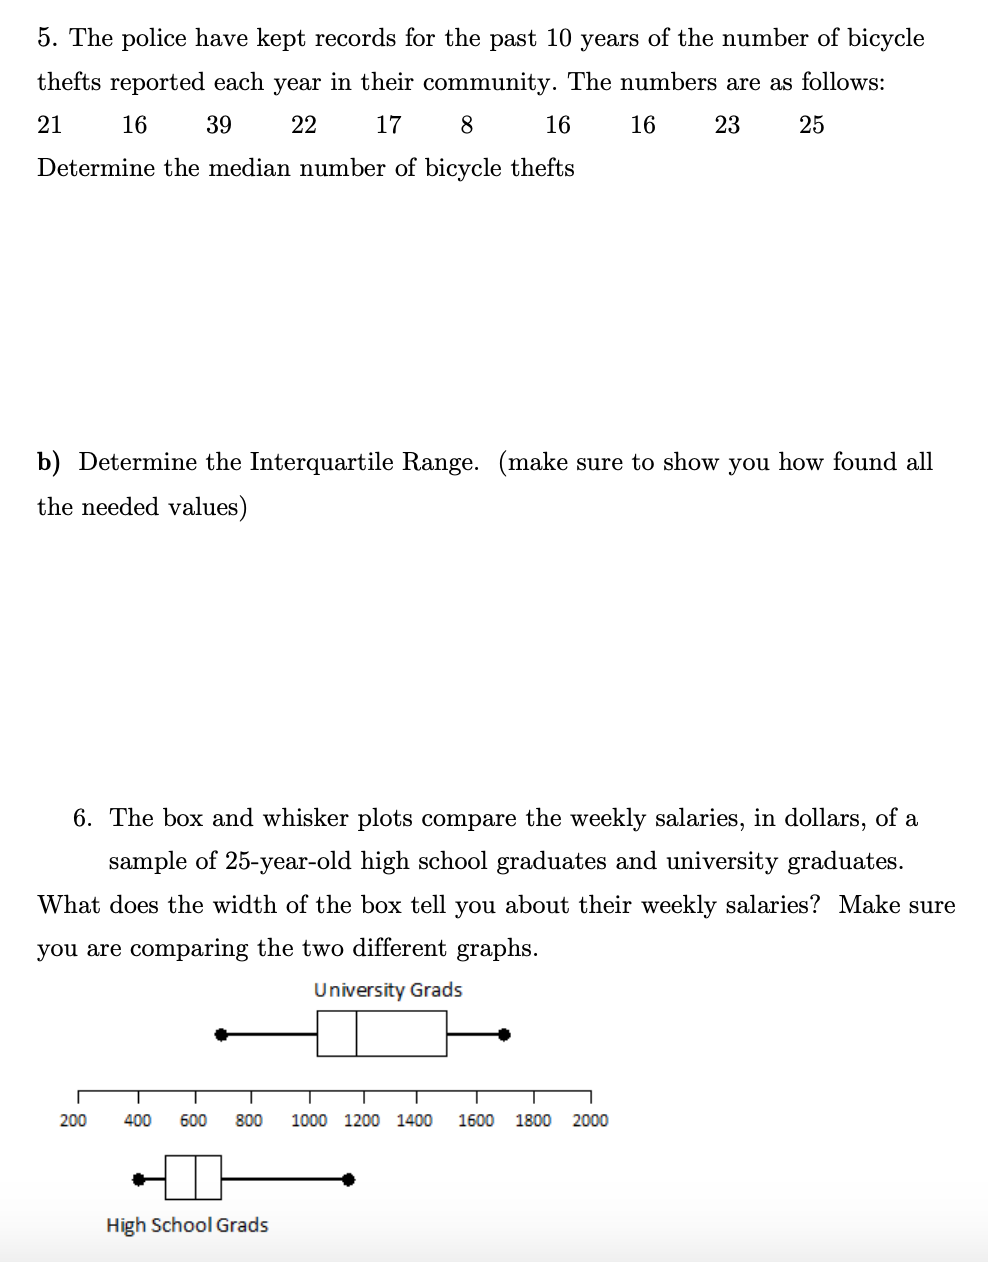
5. The table shows the maximum temperatures in 15 cities in Ontario one day in June. a) Is this a sample or population? Why? b) Determine the standard deviation of the maximum temperatures. Maximum City Temperature (C) Ham-1m c) What does the number you found for the standard deviation mean? 5. The police have kept records for the past 10 years of the number of bicycle thefts reported each year in their community. The numbers are as follows: 21 16 39 22 17 8 16 16 23 25 Determine the median number of bicycle thefts b) Determine the Interquartile Range. (make sure to show you how found all the needed values) 6. The box and whisker plots compare the weekly salaries, in dollars, of a sample of 25yearold high school graduates and university graduates. What does the width of the box tell you about their weekly salaries? Make sure you are comparing the two different graphs. U nivetsity Grads -|:|: 200400600300100012001400160013002000 FIE- H'gh School Grads
Step by Step Solution
There are 3 Steps involved in it

Get step-by-step solutions from verified subject matter experts