

Question: 5. The testing data set (inputs: A, B, and C, output: Class) is given together with testing results of the classification (Predicted output). a) Find
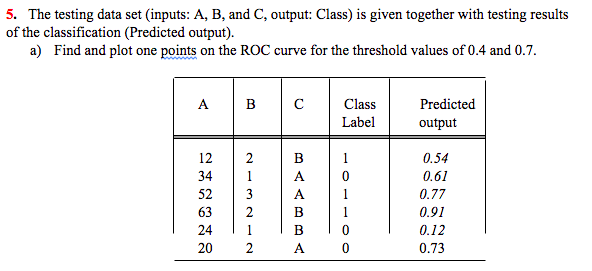

5. The testing data set (inputs: A, B, and C, output: Class) is given together with testing results of the classification (Predicted output). a) Find and plot one points on the ROC curve for the threshold values of 0.4 and 0.7. A B C Class Predicted Label output 12 0.54 34 0.61 52 0.77 N-NWEN 63 0.91 24 0.12 20 A 0.73
Step by Step Solution
There are 3 Steps involved in it
1 Expert Approved Answer
Step: 1 Unlock

Question Has Been Solved by an Expert!
Get step-by-step solutions from verified subject matter experts
Step: 2 Unlock
Step: 3 Unlock