

Question: 5. Use Q3 (Age) to introduce a new variable as per the details given below: Name of the new variable as 'Age Group'. Young: Less
5. Use Q3 (Age) to introduce a new variable as per the details given below: Name of the new variable as 'Age Group'. Young: Less than 25 years Middle age : 25 to less than 45 years senior : 45 year than above 6. : 45 years (Marks6) Find the frequency distribution table of 'Age Group' 7. 7. Make cross - table between Q1 and Age Group showing the data in percentage, and write your comment.
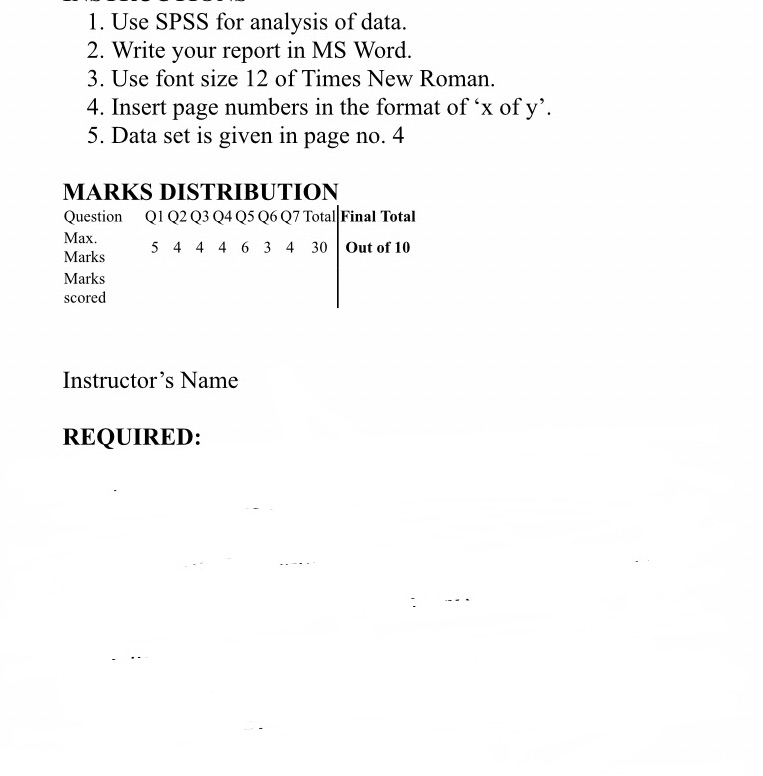
1. Use SPSS for analysis of data. 2. Write your report in MS Word. 3. Use font size 12 of Times New Roman. 4. Insert page numbers in the format of 'x of y'. 5. Data set is given in page no. 4 MARKS DISTRIBUTION Question Q1 Q2 Q3 Q4 Q5 Q6 Q? Total Final Total Max. Marks 5 4 4 4 e 3 4 so Uutofl Marks scored Instructor's Name REQUIRED
Step by Step Solution
There are 3 Steps involved in it

Get step-by-step solutions from verified subject matter experts