

Question: 5 - Use the data in the Table below and determine grouping alternatives based on similarity coefficients. What information is lost when the groups are
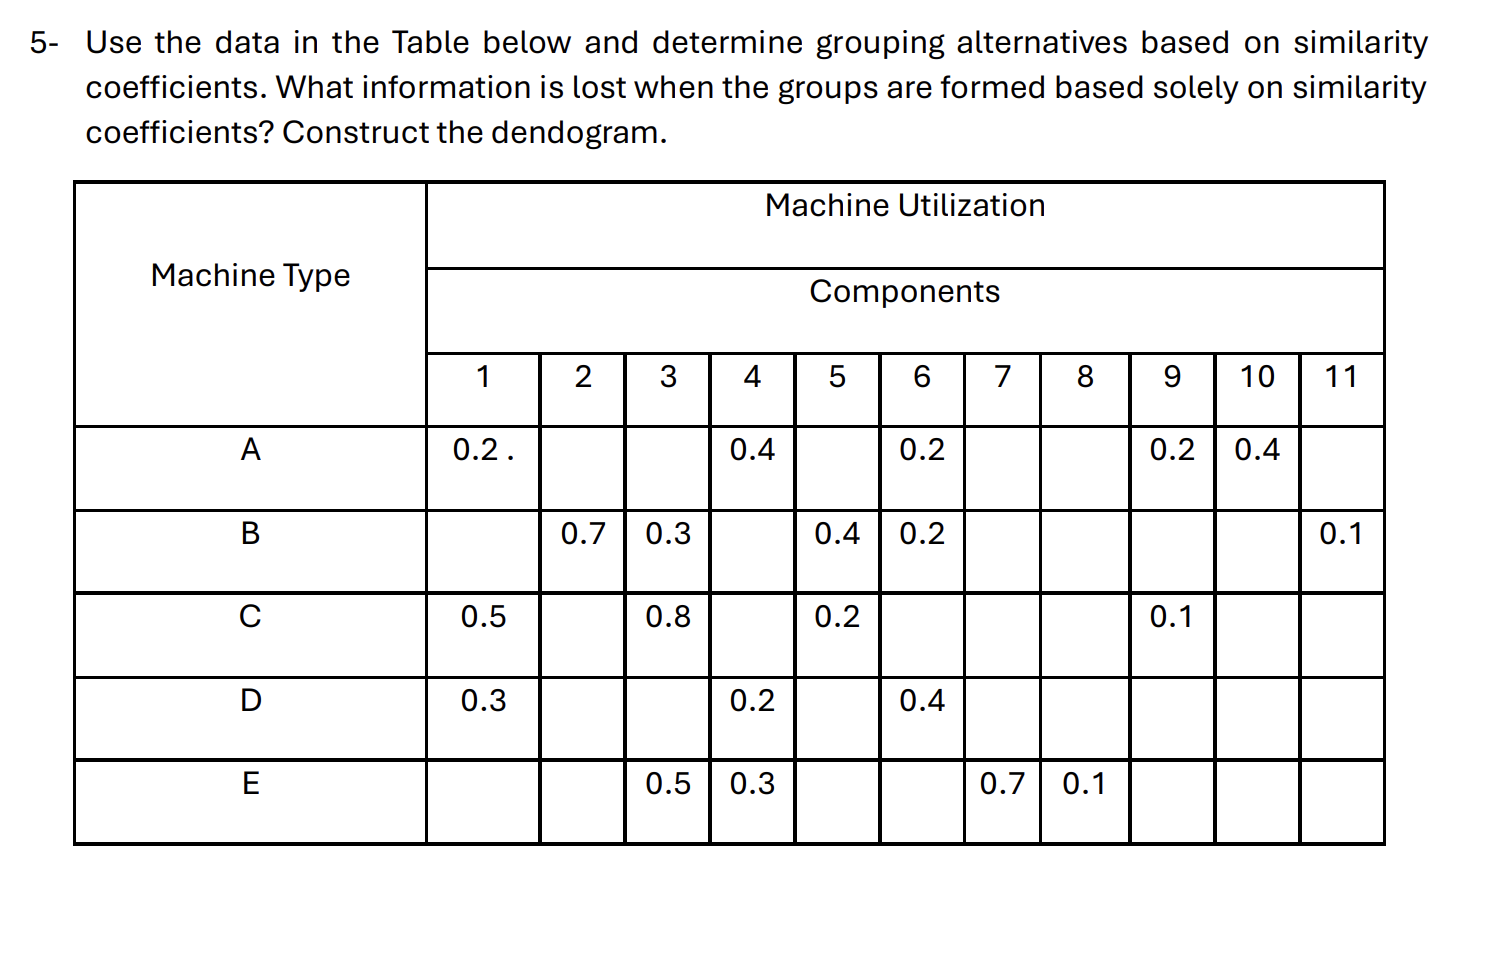
Use the data in the Table below and determine grouping alternatives based on similarity coefficients. What information is lost when the groups are formed based solely on similarity coefficients? Construct the dendogram.
begintabularcccccccccccc
hline multirowMachine Type & multicolumncMachine Utilization
hline & multicolumncComponents
hline & & & & & & & & & & &
hline A & & & & & & & & & & &
hline B & & & & & & & & & & &
hline C & & & & & & & & & & &
hline D & & & & & & & & & & &
hline E & & & & & & & & & & &
hline
endtabular
Step by Step Solution
There are 3 Steps involved in it
1 Expert Approved Answer
Step: 1 Unlock

Question Has Been Solved by an Expert!
Get step-by-step solutions from verified subject matter experts
Step: 2 Unlock
Step: 3 Unlock