

Question: 5. Using Table 4.1 below (from your course textbook), plot porosity versus permeability using excel. Using the plot, is there any correlation between porosity and
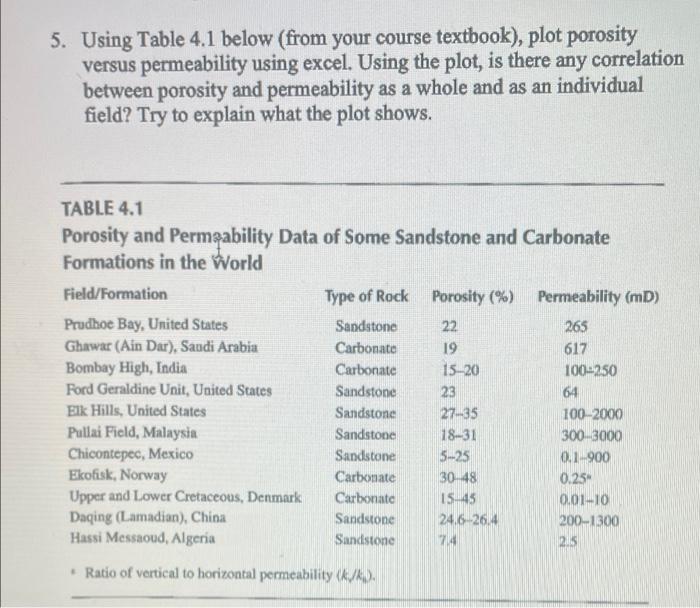
5. Using Table 4.1 below (from your course textbook), plot porosity versus permeability using excel. Using the plot, is there any correlation between porosity and permeability as a whole and as an individual field? Try to explain what the plot shows. 22 TABLE 4.1 Porosity and Permeability Data of Some Sandstone and Carbonate Formations in the World Field/Formation Type of Rock Porosity (%) Permeability (m) Prudhoe Bay, United States Sandstone 265 Ghawar (Ain Dar), Saudi Arabia Carbonate 19 617 Bombay High, India Carbonate 15-20 100-250 Ford Geraldine Unit, United States Sandstone 23 64 Elk Hills, United States Sandstone 27435 100-2000 Pallai Field, Malaysia Sandstone 18-31 300-3000 Chicontepec, Mexico Sandstone 5-25 0.1900 Ekofisk, Norway Carbonate 30-48 0.25 Upper and Lower Cretaceous, Denmark Carbonate 15.45 001-10 Daging (Lamadian), China Sandstone 24,6 26.4 200-1300 Hassi Messaoud, Algeria Sandstone 2015 74 Ratio of vertical to horizontal permeability /
Step by Step Solution
There are 3 Steps involved in it

Get step-by-step solutions from verified subject matter experts