

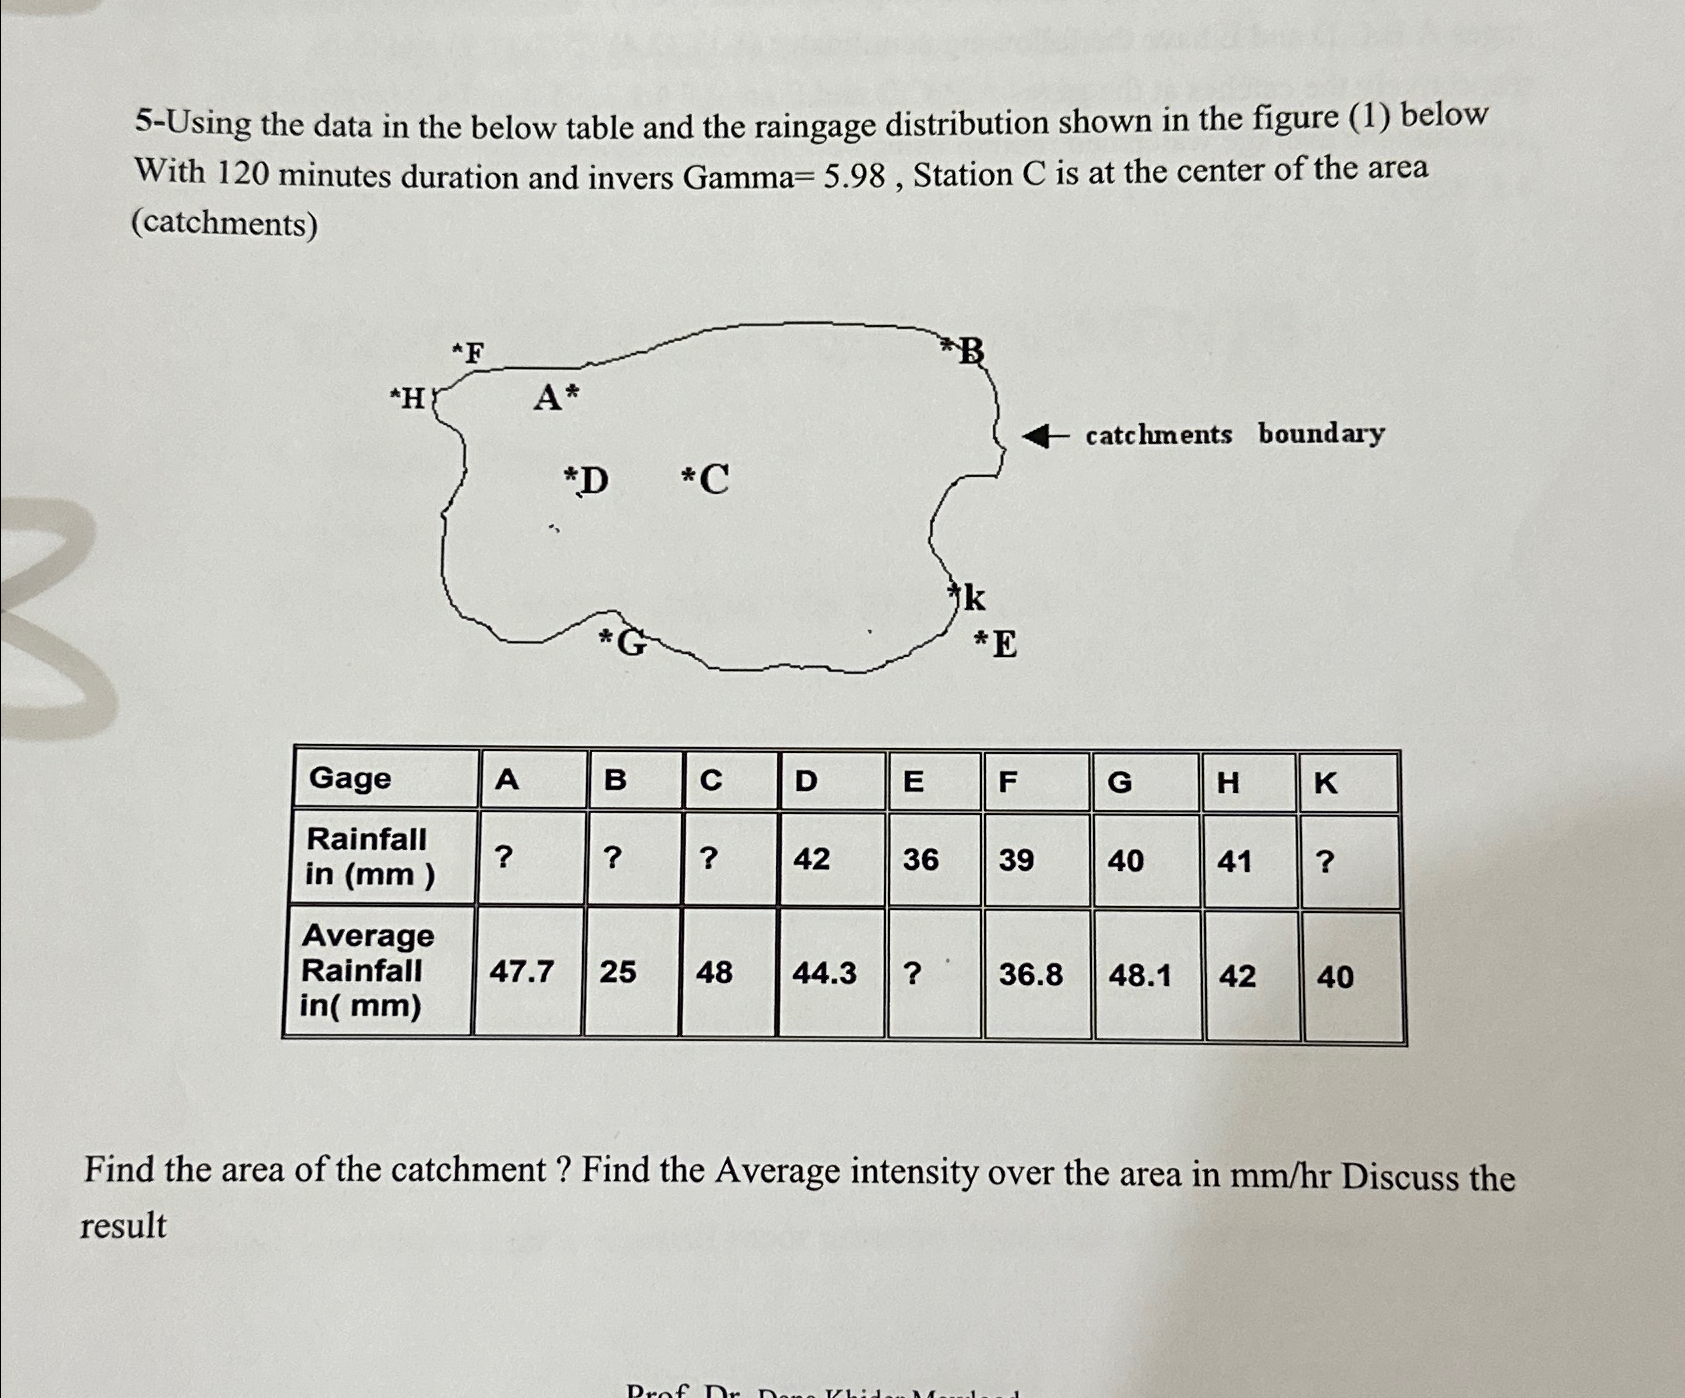
Question: 5 - Using the data in the below table and the raingage distribution shown in the figure ( 1 ) below With 1 2 0
Using the data in the below table and the raingage distribution shown in the figure below With minutes duration and invers Gamma Station is at the center of the area catchments
tableGageABCDEFGHKtableRainfallin
Step by Step Solution
There are 3 Steps involved in it
1 Expert Approved Answer
Step: 1 Unlock

Question Has Been Solved by an Expert!
Get step-by-step solutions from verified subject matter experts
Step: 2 Unlock
Step: 3 Unlock