

Question: 5. Using the experimental observations given below, a) First construct the phase diagram between A and B metals at 1 atm in the temperature range
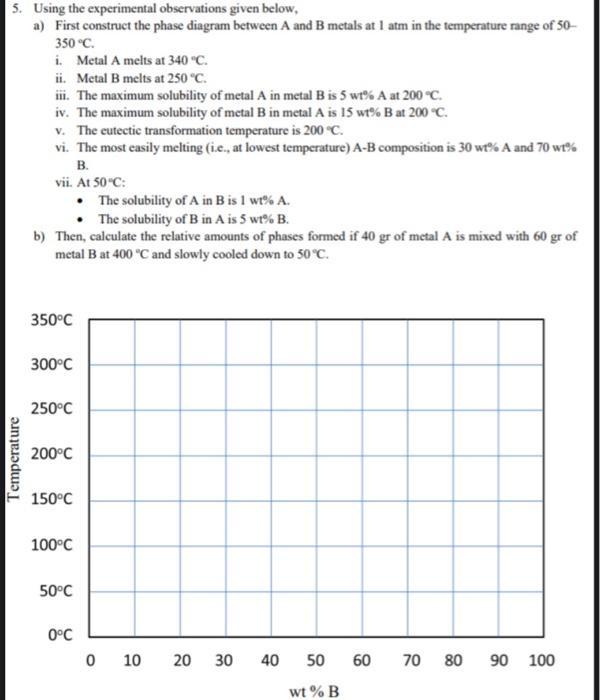
5. Using the experimental observations given below, a) First construct the phase diagram between A and B metals at 1 atm in the temperature range of 50 350C. i. Metal A melts at 340C. ii. Metal B melts at 250C. iii. The maximum solubility of metal A in metal B is 5 wt\% A at 200C. iv. The maximum solubility of metal B in metal A is 15 wt\% B at 200C. v. The eutectic transformation temperature is 200C. vi. The most easily melting (i.e., at lowest temperature) AB composition is 30 wt\% A and 70 wt B. vii. At 50C : - The solubility of A in B is 1 wt A. - The solubility of B in A is 5 wt\% B. b) Then, calculate the relative amounts of phases formed if 40gr of metal A is mixed with 60gr of metal B at 400C and slowly cooled down to 50C
Step by Step Solution
There are 3 Steps involved in it

Get step-by-step solutions from verified subject matter experts