

5) We want to explore the effect of parameters on a binomial distribution (this is a...
Fantastic news! We've Found the answer you've been seeking!
Question:

Transcribed Image Text:
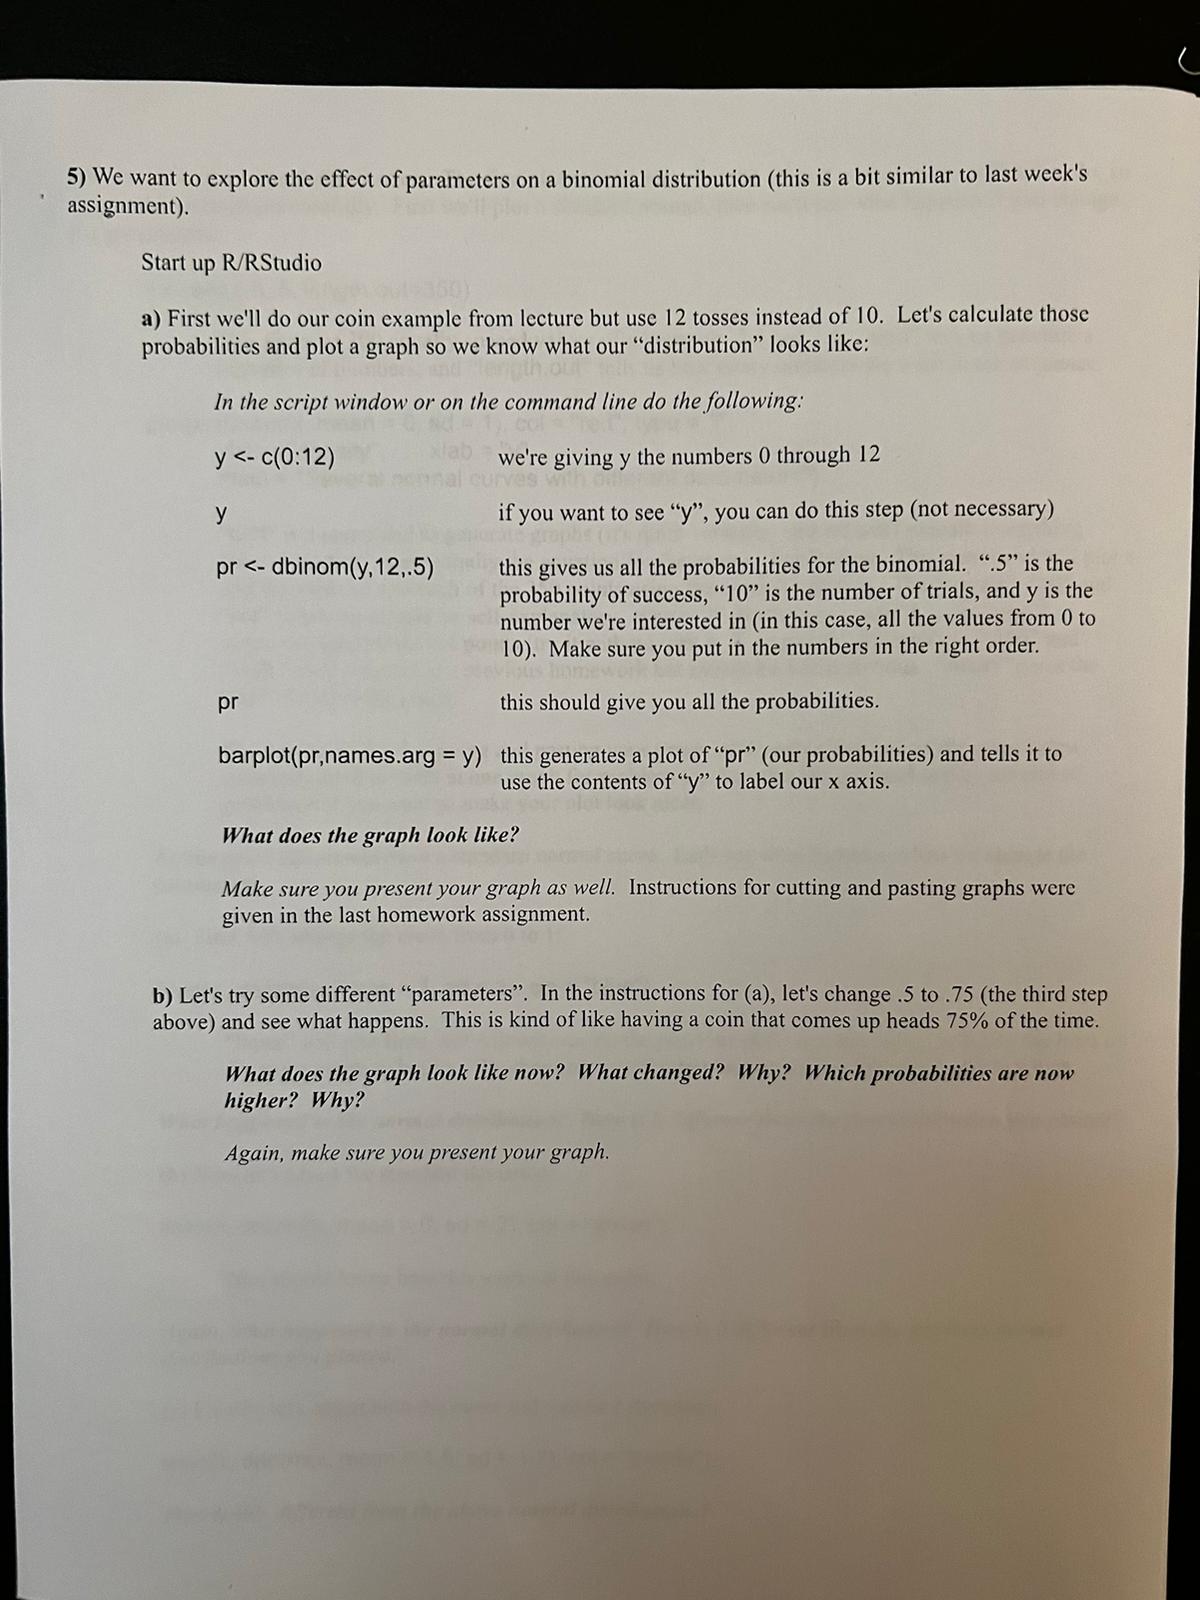
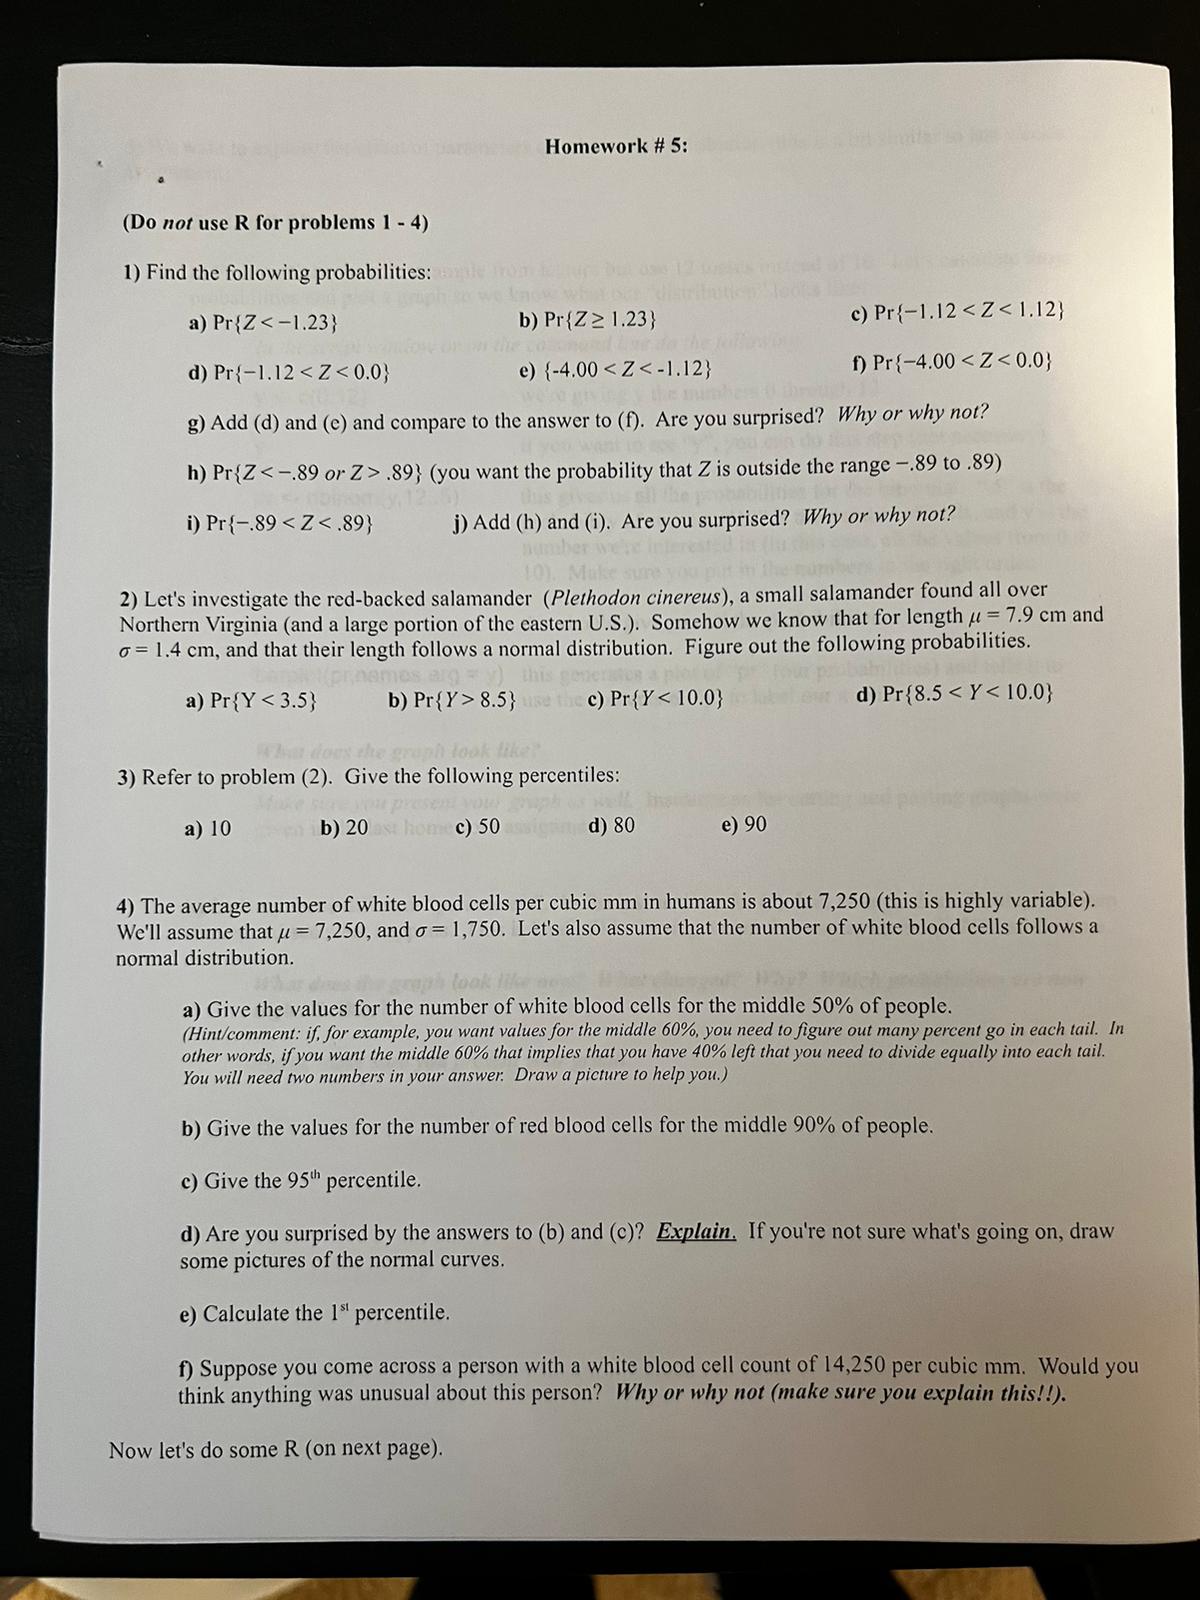
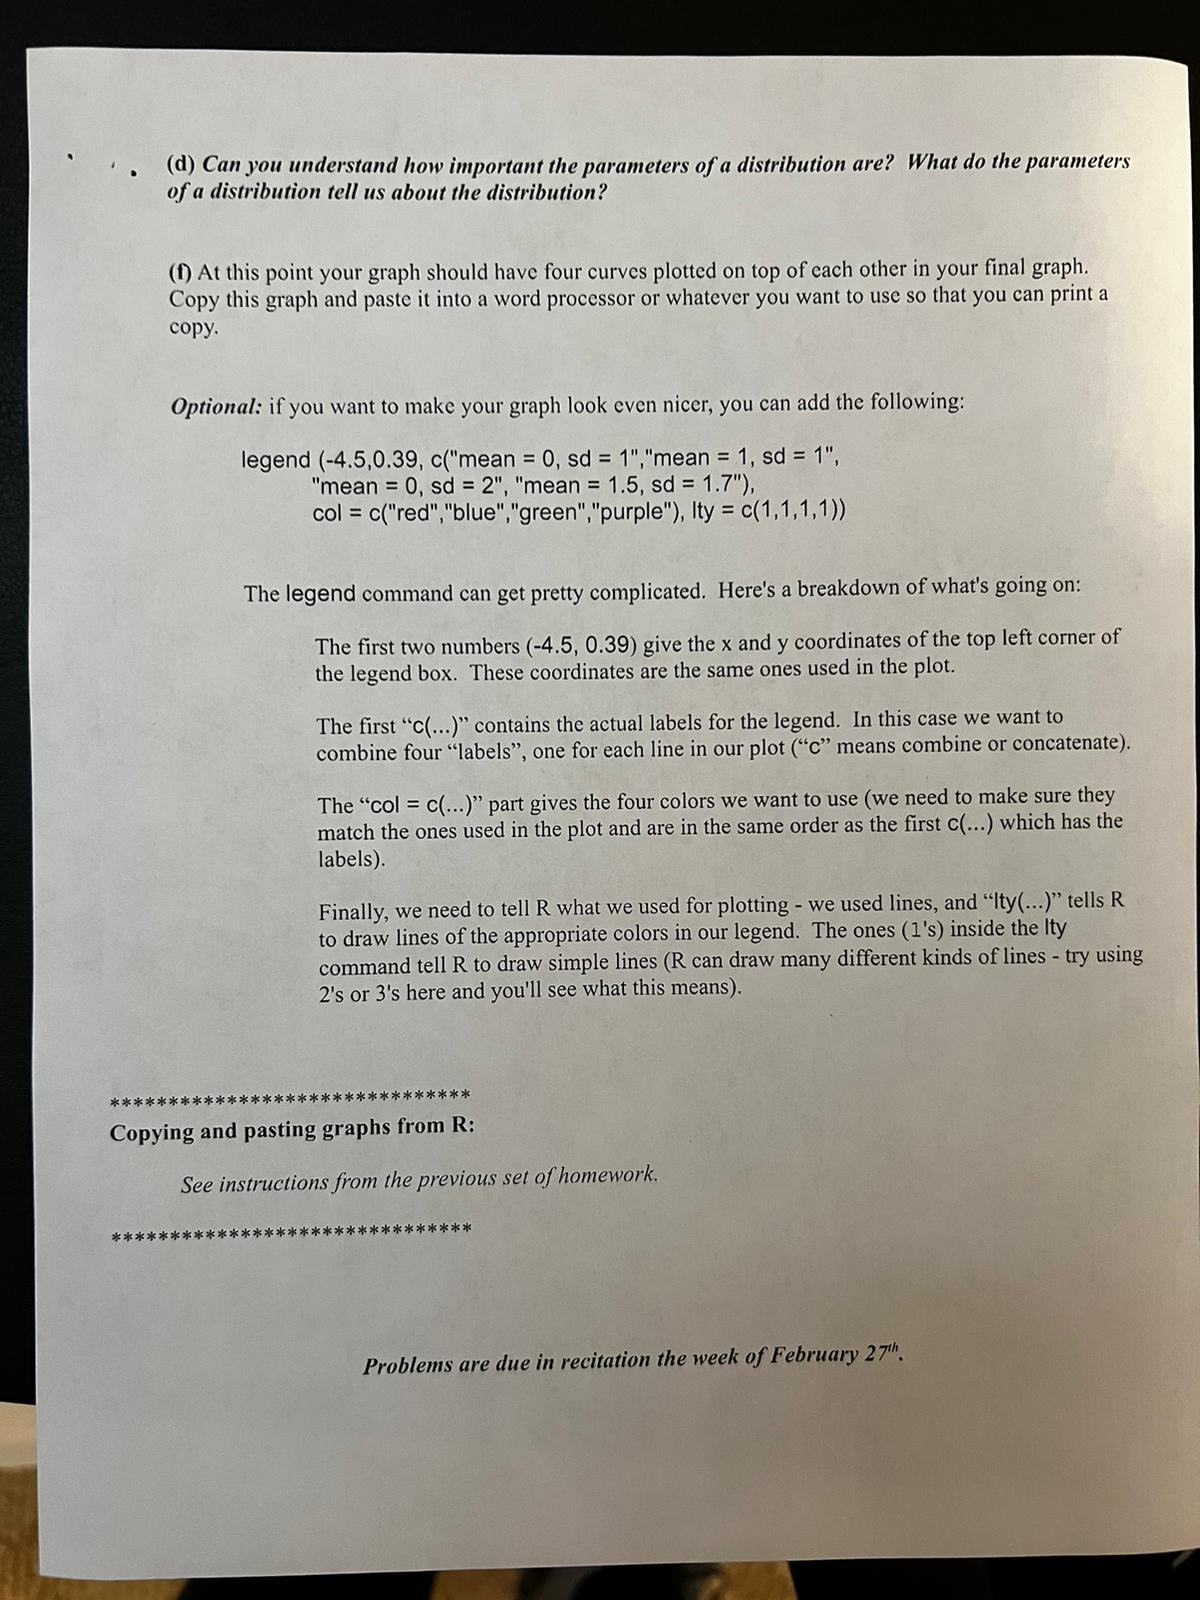
5) We want to explore the effect of parameters on a binomial distribution (this is a bit similar to last week's assignment). Start up R/RStudio a) First we'll do our coin example from lecture but use 12 tosses instead of 10. Let's calculate those probabilities and plot a graph so we know what our "distribution" looks like: In the script window or on the command line do the following: y Homework # 5: (Do not use R for problems 1 - 4) 1) Find the following probabilities: a) Pr{Z (d) Can you understand how important the parameters of a distribution are? What do the parameters of a distribution tell us about the distribution? (f) At this point your graph should have four curves plotted on top of each other in your final graph. Copy this graph and paste it into a word processor or whatever you want to use so that you can print a copy. Optional: if you want to make your graph look even nicer, you can add the following: legend (-4.5,0.39, c("mean = 0, sd = 1","mean = 1, sd = 1", "mean = 0, sd = 2", "mean = 1.5, sd = 1.7"), col = c("red","blue","green","purple"), Ity = c(1,1,1,1)) The legend command can get pretty complicated. Here's a breakdown of what's going on: The first two numbers (-4.5, 0.39) give the x and y coordinates of the top left corner of the legend box. These coordinates are the same ones used in the plot. The first "c(...)" contains the actual labels for the legend. In this case we want to combine four "labels", one for each line in our plot ("c" means combine or concatenate). The "col = c(...)" part gives the four colors we want to use (we need to make sure they match the ones used in the plot and are in the same order as the first c(...) which has the labels). Finally, we need to tell R what we used for plotting - we used lines, and "Ity(...)" tells R to draw lines of the appropriate colors in our legend. The ones (1's) inside the Ity command tell R to draw simple lines (R can draw many different kinds of lines - try using 2's or 3's here and you'll see what this means). ******************************* Copying and pasting graphs from R: See instructions from the previous set of homework. ***** ************* Problems are due in recitation the week of February 27th. 6) Now let's try a normal distribution. The first plot will be easy, but the second will be more difficult to do, so follow the instructions carefully. First we'll plot a standard normal, then we'll see what happens if you change the parameters. x 5) We want to explore the effect of parameters on a binomial distribution (this is a bit similar to last week's assignment). Start up R/RStudio a) First we'll do our coin example from lecture but use 12 tosses instead of 10. Let's calculate those probabilities and plot a graph so we know what our "distribution" looks like: In the script window or on the command line do the following: y Homework # 5: (Do not use R for problems 1 - 4) 1) Find the following probabilities: a) Pr{Z (d) Can you understand how important the parameters of a distribution are? What do the parameters of a distribution tell us about the distribution? (f) At this point your graph should have four curves plotted on top of each other in your final graph. Copy this graph and paste it into a word processor or whatever you want to use so that you can print a copy. Optional: if you want to make your graph look even nicer, you can add the following: legend (-4.5,0.39, c("mean = 0, sd = 1","mean = 1, sd = 1", "mean = 0, sd = 2", "mean = 1.5, sd = 1.7"), col = c("red","blue","green","purple"), Ity = c(1,1,1,1)) The legend command can get pretty complicated. Here's a breakdown of what's going on: The first two numbers (-4.5, 0.39) give the x and y coordinates of the top left corner of the legend box. These coordinates are the same ones used in the plot. The first "c(...)" contains the actual labels for the legend. In this case we want to combine four "labels", one for each line in our plot ("c" means combine or concatenate). The "col = c(...)" part gives the four colors we want to use (we need to make sure they match the ones used in the plot and are in the same order as the first c(...) which has the labels). Finally, we need to tell R what we used for plotting - we used lines, and "Ity(...)" tells R to draw lines of the appropriate colors in our legend. The ones (1's) inside the Ity command tell R to draw simple lines (R can draw many different kinds of lines - try using 2's or 3's here and you'll see what this means). ******************************* Copying and pasting graphs from R: See instructions from the previous set of homework. ***** ************* Problems are due in recitation the week of February 27th. 6) Now let's try a normal distribution. The first plot will be easy, but the second will be more difficult to do, so follow the instructions carefully. First we'll plot a standard normal, then we'll see what happens if you change the parameters. x
Expert Answer:

Posted Date:
Students also viewed these mathematics questions
-
Assume that Jimmy Cash has $2000 in his checking account at Folsom Bank and uses his checking account card to withdraw $200 of cash from the banks ATM machine. By what dollar amount did the M1 money...
-
Wang Company currently has 200,000 shares of $1 par common stock outstanding and 3,000 shares of $50 par preferred stock outstanding. On July 10, the board of directors declared a semiannual dividend...
-
Goose down is used in a wide variety of products, including jackets, bedding, and pillows. In recent years, the cost of down has been increasing. For example, in 2009, a pound of goose down sold for...
-
What accounts are affected, and how, by a reversing entry for accrued salary expense?
-
Halloween Costumes estimates its inventory by the gross profit method. The gross profit has averaged 30% of net sales. The companys inventory records reveal the following data: Inventory, May 1 $...
-
The binarySearch algorithm of Section 5.2.2 first checks whether the target is equal to the current middle entry, before proceeding to the left or right halves if required. There is another variant...
-
The boxplot shown below results from the heights (cm) of males listed in a data set. What do the numbers in that boxplot tell us? 152 1668 175.7 180.9 195 c CID The minimum height is cm, the first...
-
How far should the recording industry be allowed to go to protect music producers and/or punish people who illegally swap music files? Industry officials have discussed the possibility of hiding...
-
On January 1 of this year, Clearwater Corporation sold bonds with a face value of $760,000 and a coupon rate of 7 percent. The bonds mature in 10 years and pay interest annually every December 31....
-
create an email message (in a word document) that include all the necessary parts of an effective email (Receiver, Sender, Subject line, and the parts of the email itself). Your email should...
-
Describe a positive team experience Describe a positive team experience you have had at work, school, etc., and what made it a positive experience. What from this positive team experience can you...
-
Content Knowledge You will identify the important components of a will and the purpose of making a will. InquiryYou will conduct online research, in which you will collect information and communicate...
-
3. In an experiment, there exist 3 factor with 2 levels of each. Factors Levels X Y 75 85 1 20 60 30 70 Taguchi Lg design is used in the experiment. Response values are given below: y= 42, y,= 45,...
-
QUESTION 2 The CEO of Farisha Hijab Sdn Bhd insisted on further investigation to be carried out that he also required Mr Muaz to conduct the analysis of variance for the material and labour of the...
Dynamic Human Resource Systems Cross National Comparisons 1st Edition - ISBN: 311015515X - Free Book

Study smarter with the SolutionInn App