

Question: Write a Matlab code for reading the above two s2p files and plotting the amplitude and phase of each of the four S parameters
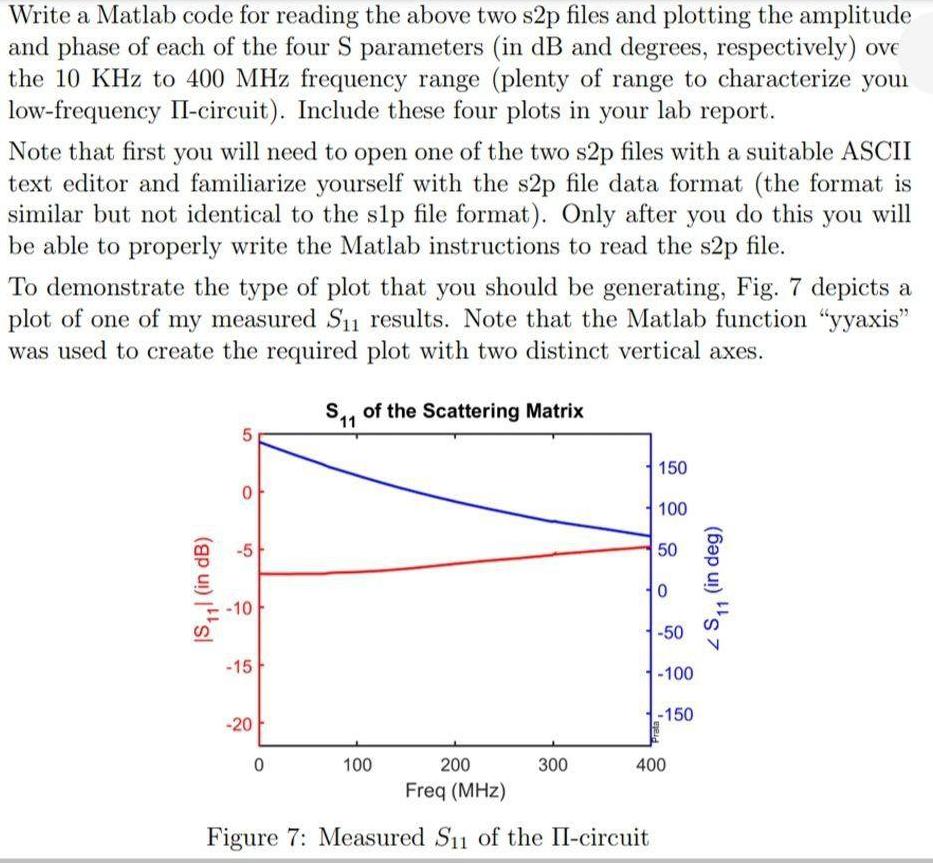
Write a Matlab code for reading the above two s2p files and plotting the amplitude and phase of each of the four S parameters (in dB and degrees, respectively) ove the 10 KHz to 400 MHz frequency range (plenty of range to characterize your low-frequency II-circuit). Include these four plots in your lab report. Note that first you will need to open one of the two s2p files with a suitable ASCII text editor and familiarize yourself with the s2p file data format (the format is similar but not identical to the slp file format). Only after you do this you will be able to properly write the Matlab instructions to read the s2p file. To demonstrate the type of plot that you should be generating, Fig. 7 depicts a plot of one of my measured S1 results. Note that the Matlab function "yyaxis" was used to create the required plot with two distinct vertical axes. S11 of the Scattering Matrix 150 0 100 50 0 -50 -100 -150 0 100 200 300 400 Freq (MHz) Figure 7: Measured S1 of the II-circuit 5 (in dB) sl -10 -15 -20 (6) 7
Step by Step Solution
3.46 Rating (166 Votes )
There are 3 Steps involved in it
MATLAB an abbreviation of MATrix LABoratory is a proprietary multiparadigm programming language and ... View full answer

Get step-by-step solutions from verified subject matter experts