

Question: 5. You are constructing a 90% condence interval for the difference of means from simple random samples from two independent populations. The sample sizes are
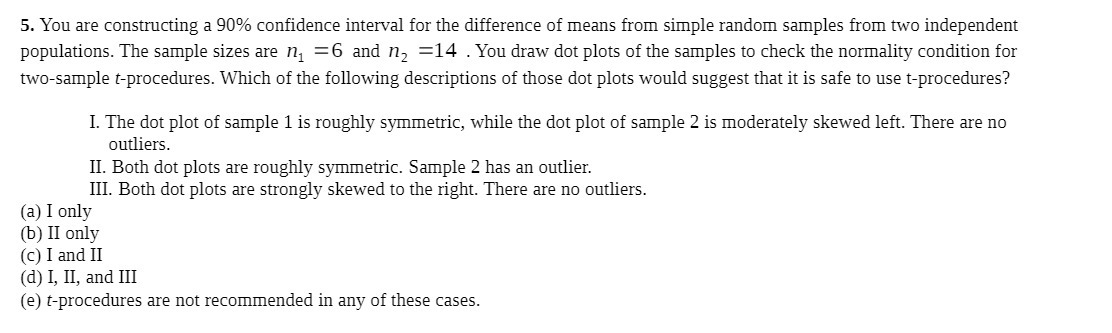
5. You are constructing a 90% condence interval for the difference of means from simple random samples from two independent populations. The sample sizes are n1 = 6 and n2 =14 . You draw dot plots of the samples to check the normality condition for twosample tprocedures. Which of the followng descriptions of those dot plots would suggest that it is safe to use tprocedures? I. The dot plot of sample 1 is roughly symmetric, while the dot plot of sample 2 is moderately skewed left. There are no outliers. 1]. Both dot plots are roughly symmetric. Sample 2 has an outlier. III. Both dot plots are strongly skewed to the right. There are no outliers. (a) I only (fa) II only (c) I and I] (d) I, II, and III (e) tprocedures are not recommended in any of these cases
Step by Step Solution
There are 3 Steps involved in it

Get step-by-step solutions from verified subject matter experts