

Question: 50 Arranging Data 51 Below are sales data for a company that is highly seasonal around the Q4 holidays season. 52 You are going to
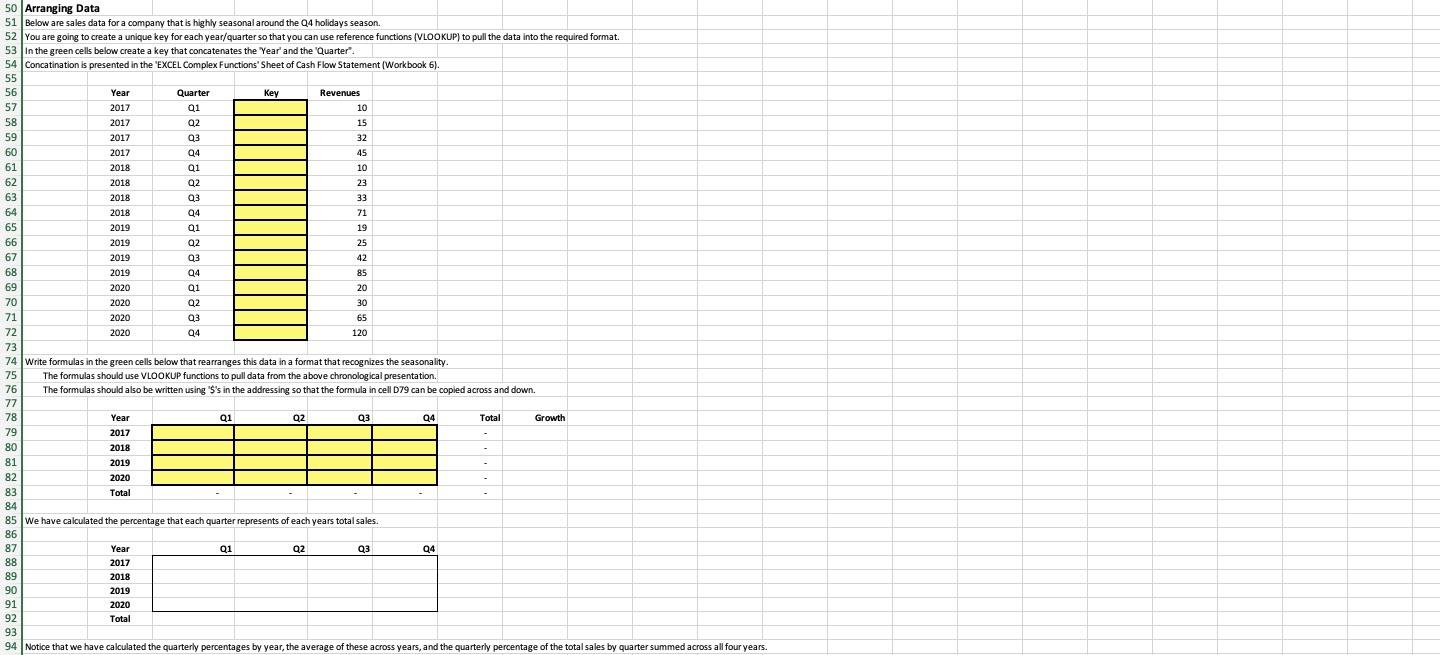
50 Arranging Data 51 Below are sales data for a company that is highly seasonal around the Q4 holidays season. 52 You are going to create a unique key for each year/quarter so that you can use reference functions (VLOOKUP) to pull the data into the required format. 53 in the green cells below create a key that concatenates the Year and the Quarter". 54 Concatination is presented in the "EXCEL Complex Functions' Sheet of Cash Flow Statement Workbook 6). 55 56 Year Quarter Key Revenues 57 2017 91 10 58 2017 Q2 15 59 2017 Q3 32 60 2017 94 45 61 2018 Q1 10 62 2018 92 23 63 2018 03 33 64 2018 04 71 65 2019 01 19 66 2019 Q2 25 67 2019 Q3 42 68 2019 94 85 69 2020 91 20 70 2020 02 30 71 2020 93 65 72 2020 04 120 73 74 Write formulas in the green cells below that rearranges this data in a format that recognizes the seasonality 75 The formulas should use VLOOKUP functions to pull data from the above chronological presentation. 76 The formulas should also be written using 'S's in the addressing so that the formula in cell D79 can be copied across and down. 77 78 Year Q1 Q2 Q3 Q4 Total Growth 79 2017 80 2018 81 2019 82 2020 83 Total 84 85 We have calculated the percentage that each quarter represents of each years total sales. 86 87 Year Q1 Q2 93 Q4 88 2017 89 2018 90 2019 91 2020 92 Total 93 94 Notice that we have calculated the quarterly percentages by year, the average of these across years, and the quarterly percentage of the total sales by quarter summed across all four years. 50 Arranging Data 51 Below are sales data for a company that is highly seasonal around the Q4 holidays season. 52 You are going to create a unique key for each year/quarter so that you can use reference functions (VLOOKUP) to pull the data into the required format. 53 in the green cells below create a key that concatenates the Year and the Quarter". 54 Concatination is presented in the "EXCEL Complex Functions' Sheet of Cash Flow Statement Workbook 6). 55 56 Year Quarter Key Revenues 57 2017 91 10 58 2017 Q2 15 59 2017 Q3 32 60 2017 94 45 61 2018 Q1 10 62 2018 92 23 63 2018 03 33 64 2018 04 71 65 2019 01 19 66 2019 Q2 25 67 2019 Q3 42 68 2019 94 85 69 2020 91 20 70 2020 02 30 71 2020 93 65 72 2020 04 120 73 74 Write formulas in the green cells below that rearranges this data in a format that recognizes the seasonality 75 The formulas should use VLOOKUP functions to pull data from the above chronological presentation. 76 The formulas should also be written using 'S's in the addressing so that the formula in cell D79 can be copied across and down. 77 78 Year Q1 Q2 Q3 Q4 Total Growth 79 2017 80 2018 81 2019 82 2020 83 Total 84 85 We have calculated the percentage that each quarter represents of each years total sales. 86 87 Year Q1 Q2 93 Q4 88 2017 89 2018 90 2019 91 2020 92 Total 93 94 Notice that we have calculated the quarterly percentages by year, the average of these across years, and the quarterly percentage of the total sales by quarter summed across all four years
Step by Step Solution
There are 3 Steps involved in it

Get step-by-step solutions from verified subject matter experts