

Question: 52 61 70 79 88 07 Based on the graph of this normal distribution, a. The mean is b. The standard deviation is c. 68%
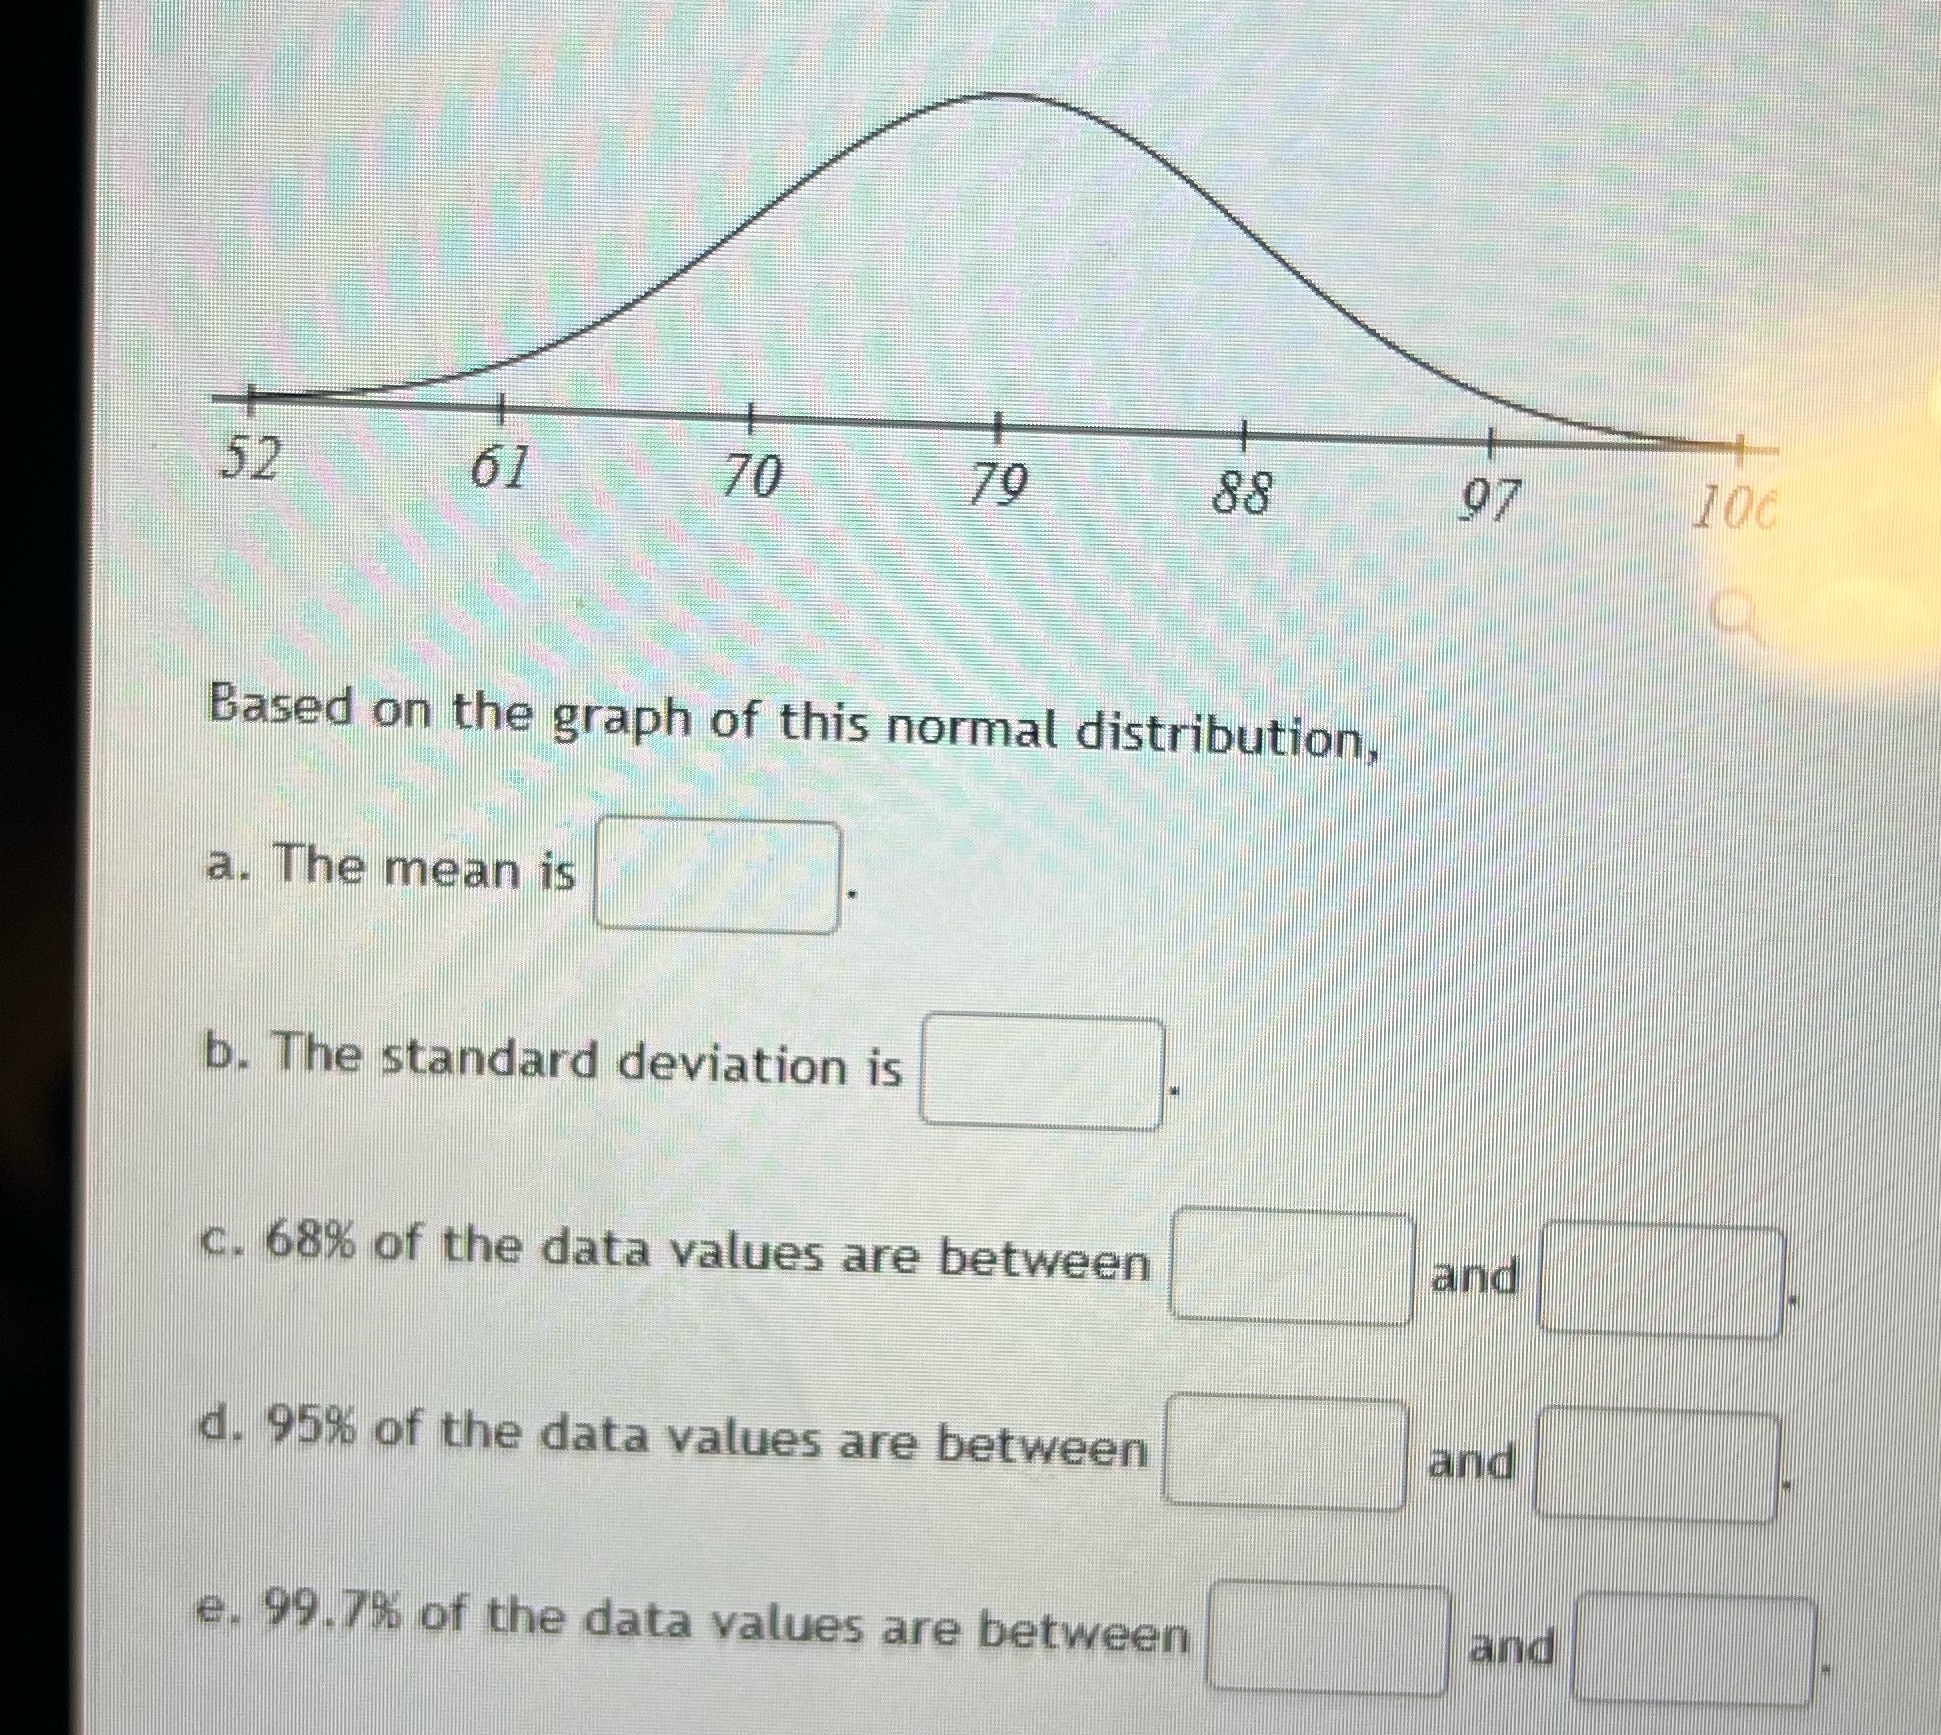
52 61 70 79 88 07 Based on the graph of this normal distribution, a. The mean is b. The standard deviation is c. 68% of the data values are between and d. 95% of the data values are between and e. 99.7%% of the data values are between and
Step by Step Solution
There are 3 Steps involved in it
1 Expert Approved Answer
Step: 1 Unlock

Question Has Been Solved by an Expert!
Get step-by-step solutions from verified subject matter experts
Step: 2 Unlock
Step: 3 Unlock