

Question: 52. Analyzing College Grade Point Average. Recall that in exercise 49, the admissions officer for Clearwater College developed the following estimated regression equation relating final
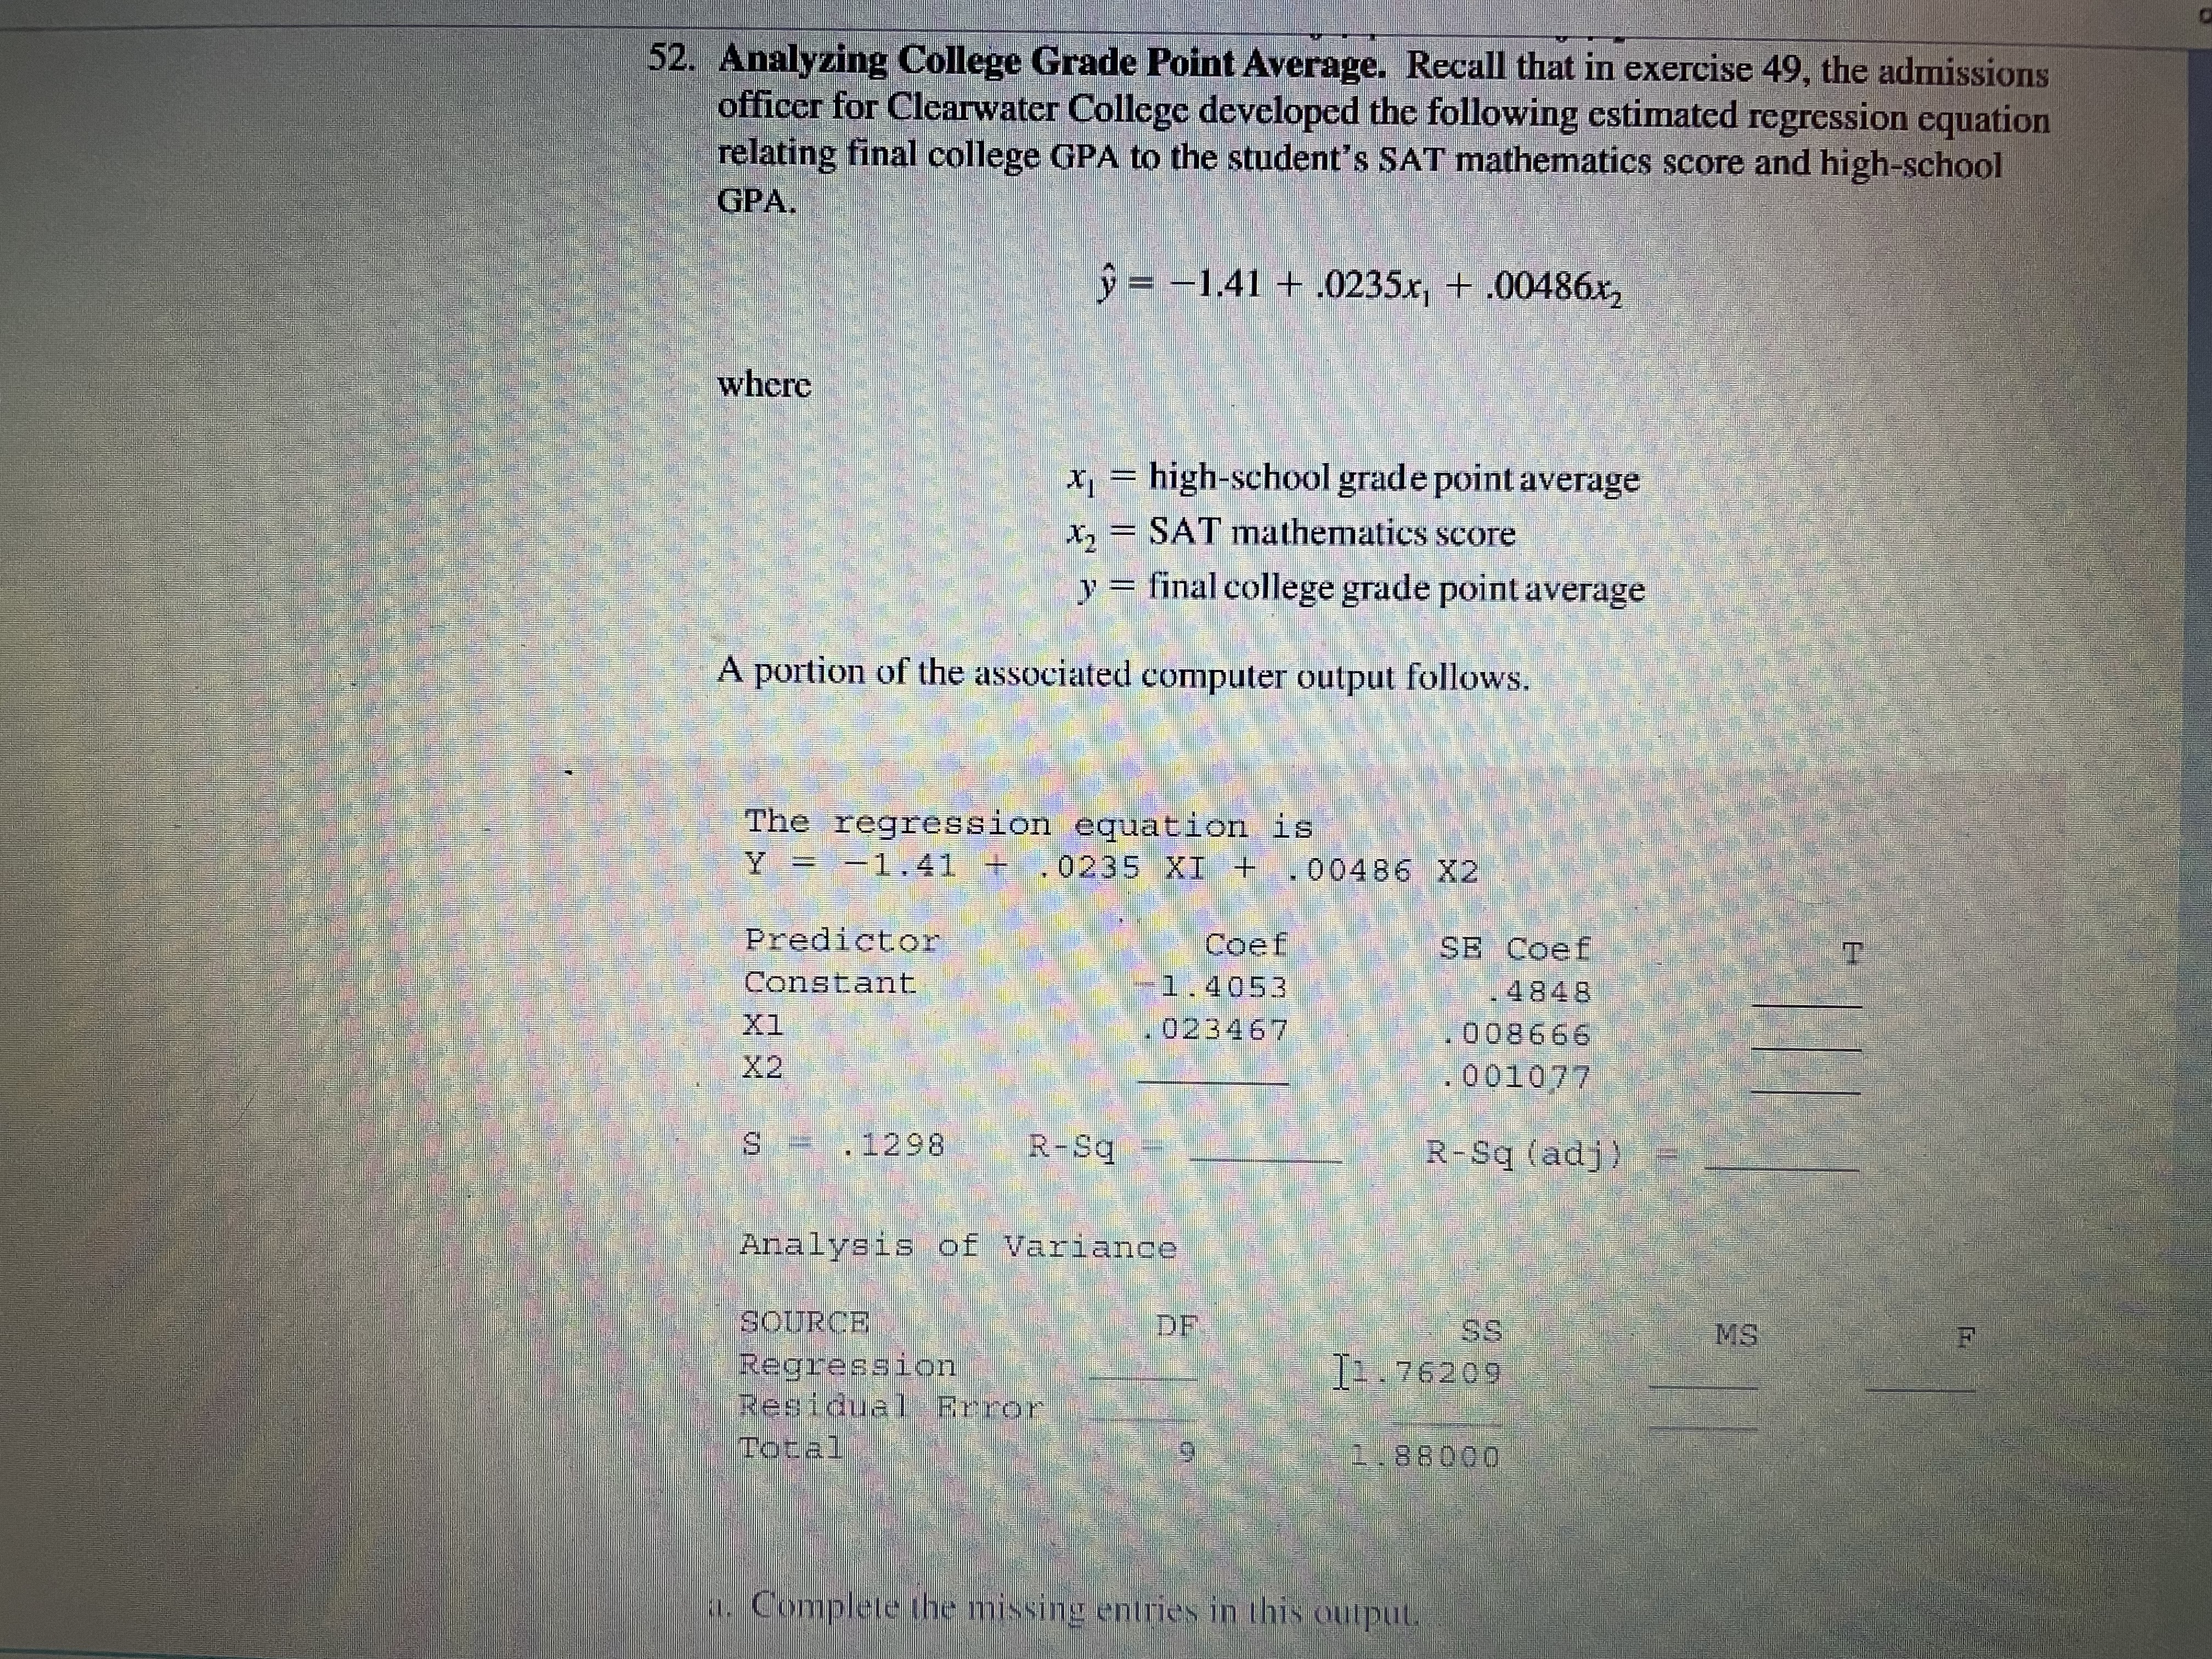
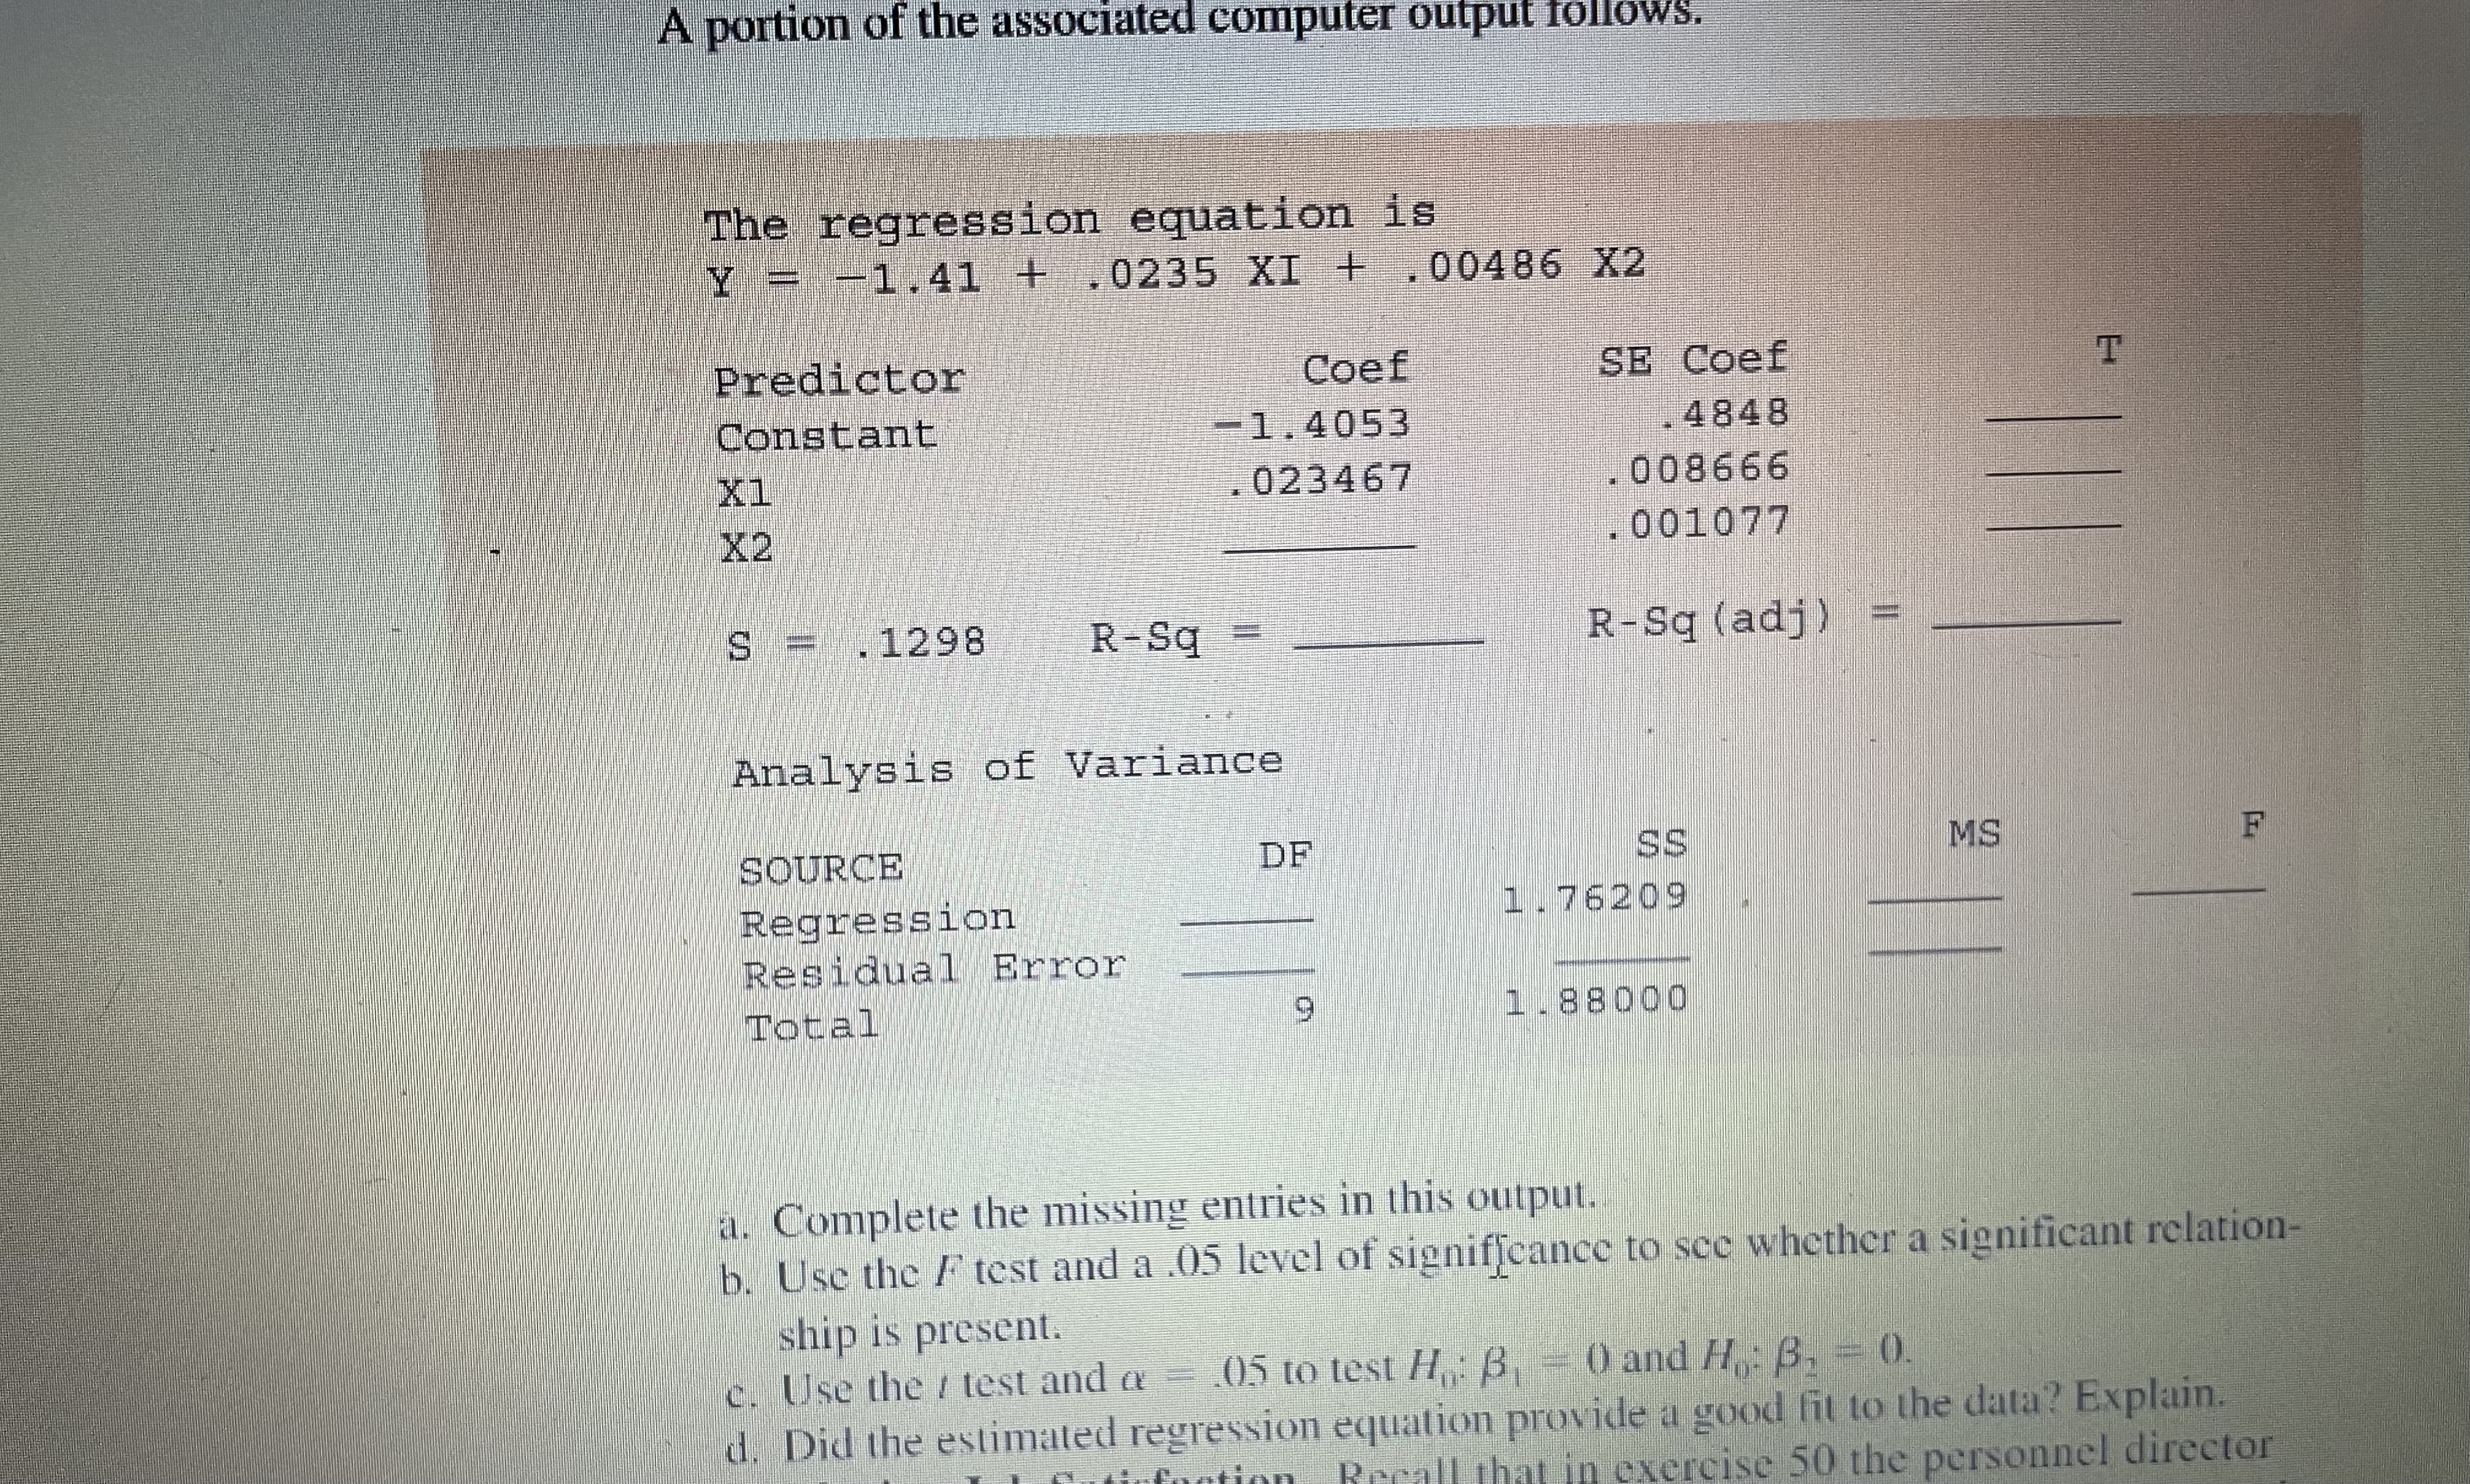
52. Analyzing College Grade Point Average. Recall that in exercise 49, the admissions officer for Clearwater College developed the following estimated regression equation relating final college GPA to the student's SAT mathematics score and high-school GPA. " = -1.41 + .0235x, + .00486*2 where x1 - high-school grade point average 2 - SAT mathematics score y - final college grade point average A portion of the associated computer output follows. The regression equation is Y = -1. 41 + . 0235 XI + . 00486 X2 Predictor Coef SE Coef Constant 1. 4053 4848 X1 023467 008666 X2 - 001077 S . 1298 R- Sq R-Sq (adj) Analysis of Variance SOURCE DF SS MS Regression [1 . 76205 Residual Error 88000 Complete the missing entries in this output.A portion of the associated computer output follows, The regression equation is Y = -1. 41 + . 0235 XI + . 00486 X2 Predictor Coef SE Coef T Constant -1. 4053 4848 023467 008666 X2 . 001077 S = . 1298 R-Sq R-Sq (adj ) = Analysis of Variance SOURCE DF SS MS F Regression 1. 76209 Residual Error Total 9 1 . 88000 a. Complete the missing entries in this output. b. Use the F test and a .05 level of significance to see whether a significant relation- ship is present. c. Use the / test and c - .05 to test H,: B, = () and /,: B. = 0. d. Did the estimated regression equation provide a good fit to the data? Explain. all that in exercise 50 the personnel director
Step by Step Solution
There are 3 Steps involved in it

Get step-by-step solutions from verified subject matter experts