

Question: 52-Week HILO (Sym) Stock DIV % PE V OL CLOSE NET CHG (End Price-Beg Price) A % Net (CHG/Beg price* 100) 1. A) According to
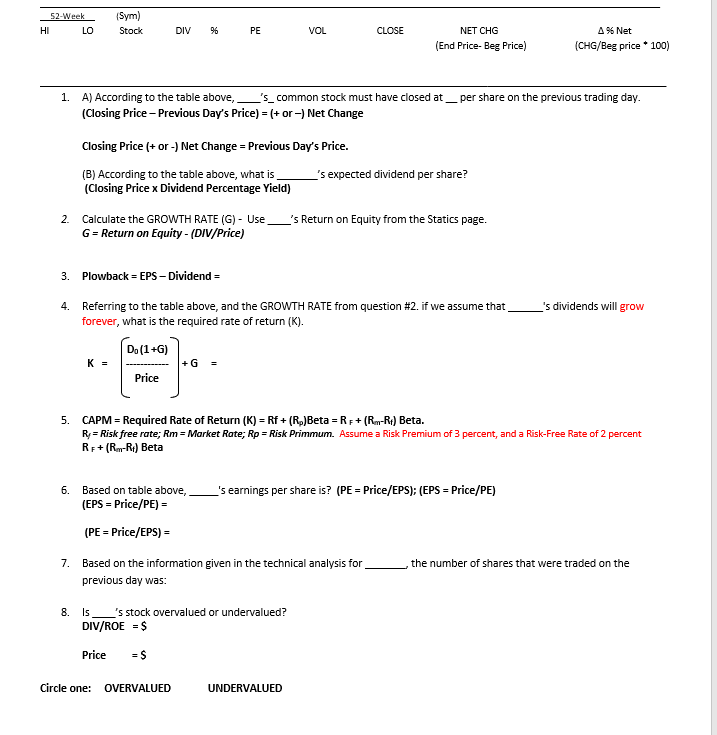
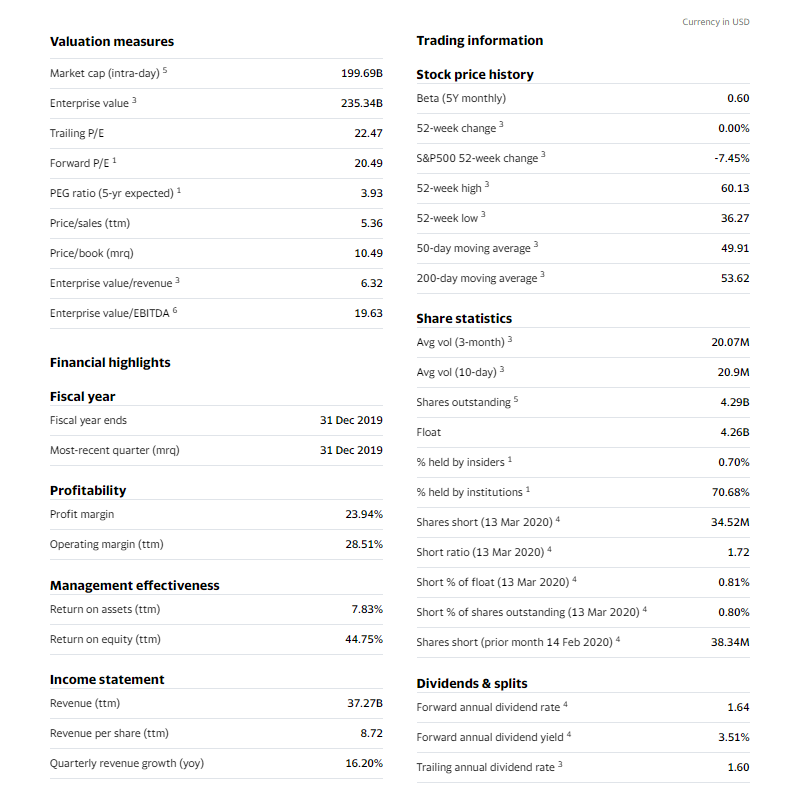
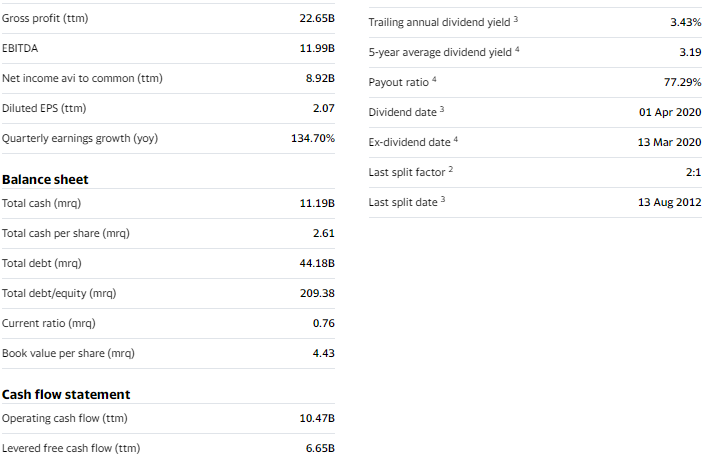
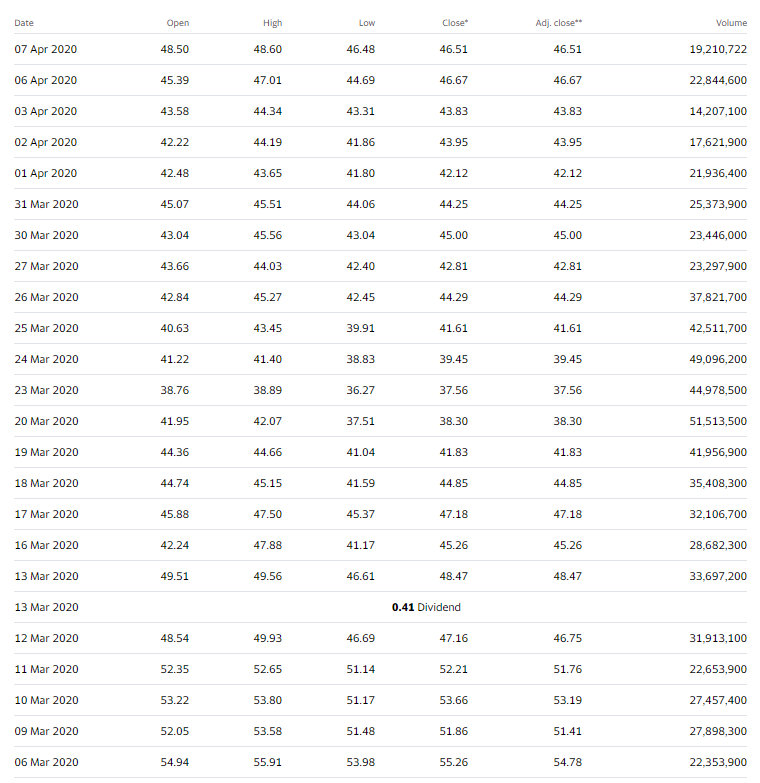
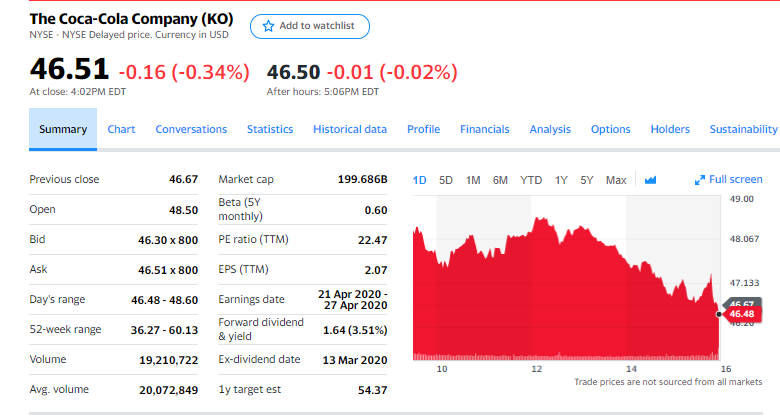
52-Week HILO (Sym) Stock DIV % PE V OL CLOSE NET CHG (End Price-Beg Price) A % Net (CHG/Beg price* 100) 1. A) According to the table above, 's_common stock must have closed at __ per share on the previous trading day. (Closing Price - Previous Day's Price) = (+ or -) Net Change Closing Price (+ or -) Net Change = Previous Day's Price. _'s expected dividend per share? (B) According to the table above, what is_ (Closing Price x Dividend Percentage Yield) 2. Calculate the GROWTH RATE (G) - Use _'s Return on Equity from the Statics page. G= Return on Equity - (DIV/Price) 3. Plowback = EPS-Dividend = 4. Referring to the table above, and the GROWTH RATE from question #2. if we assume that_ forever, what is the required rate of return(K). _'s dividends will grow D. (1+G) + G = Price 5. CAPM = Required Rate of Return (K) = Rf+(R.)Beta = R + (R-R:) Beta. RyRisk free rate; Rm = Market Rate; Rp = Risk Primmum. Assume a Risk Premium of 3 percent, and a Risk-Free Rate of 2 percent RE+ (R-Rt) Beta 6. Based on table above, (EPS = Price/PE) = _'s earnings per share is? (PE = Price/EPS); (EPS = Price/PE) (PE = Price/EPS) = the number of shares that were traded on the 7. Based on the information given in the technical analysis for previous day was: 8. Is ___'s stock overvalued or undervalued? DIV/ROE = $ Price = $ Circle one: OVERVALUED UNDERVALUED Currency in USD Valuation measures Trading information Market cap (intra-day) 5 199.69B Stock price history Beta (5Y monthly) Enterprise value 235.34B 0.60 Trailing P/E 22.47 52-week change 0.00% Forward P/E 1 20.49 -7.45% PEG ratio (5-yr expected) 3.93 60.13 Price/sales (ttm) 5.36 S&P500 52-week change 52-week high 52-week low 50-day moving average 200-day moving average 36.27 Price/book (mra) 10.49 49.91 Enterprise value/revenue 6.32 53.62 Enterprise value/EBITDA 19.63 Share statistics Avg vol (3-month) 20.07M Financial highlights Avg vol (10-day) 20.9M Fiscal year Shares outstanding 4.29B Fiscal year ends 31 Dec 2019 Float 4.26B Most-recent quarter (mra) 31 Dec 2019 % held by insiders ? 0.70% % held by institutions 1 70.68% Profitability Profit margin 23.94% Shares short (13 Mar 2020) 34.52M Operating margin (ttm) 28.51% Short ratio (13 Mar 2020) 4 1.72 Short % of float (13 Mar 2020) 4 0.81% Management effectiveness Return on assets (ttm) 7.83% Short % of shares outstanding (13 Mar 2020) 4 0.80% Return on equity (ttm) 44.75% Shares short (prior month 14 Feb 2020) 38.34M Income statement Revenue (ttm) Dividends & splits Forward annual dividend rate 4 37.27B 1.64 Revenue per share (ttm) 8.72 Forward annual dividend yield 3.51% Quarterly revenue growth (yoy) 16.20% Trailing annual dividend rate 3 1.60 Gross profit (ttm) 22.65B Trailing annual dividend yield> 3.43% EBITDA 11.99B 5-year average dividend yield 4 3.19 Net income avi to common (ttm) 8.92B Payout ratio- 77.29% Diluted EPS (ttm) 2.07 Dividend date > 01 Apr 2020 Quarterly earnings growth (yoy) 134.70% Ex-dividend date 13 Mar 2020 Balance sheet Last split factor 2 2:1 Total cash (mra) 11.19B Last split date > 13 Aug 2012 Total cash per share (mra) 2.61 Total debt (mra) 44.18B Total debt/equity (mra) 209.38 Current ratio (mra) 0.76 Book value per share (mra) 4.43 Cash flow statement Operating cash flow (ttm) 10.47B Levered free cash flow (ttm) 6.65B Date Open High Low Close Adj. close** Volume 07 Apr 2020 48.50 48.60 46.48 46.51 46.51 19,210,722 06 Apr 2020 45.39 47.01 44.69 46.67 46.67 22,844,600 03 Apr 2020 43.58 44.34 43.31 43.83 43.83 14,207,100 02 Apr 2020 42.22 44.19 41.86 43.95 43.95 17,621,900 01 Apr 2020 42.48 43.65 41.80 42.12 42.12 21,936,400 31 Mar 2020 45.07 45.51 44.06 44.25 44.25 25,373,900 30 Mar 2020 43.04 45.56 43.04 45.00 45.00 23,446,000 27 Mar 2020 43.66 44.03 42.40 42.81 42.81 23,297,900 26 Mar 2020 42.84 45.27 42.45 44.29 44.29 37,821,700 25 Mar 2020 40.63 43.45 39.91 41.61 41.61 42,511,700 24 Mar 2020 41.22 41.40 38.83 39.45 39.45 49,096,200 23 Mar 2020 38.76 38.89 36.27 37.56 37.56 44,978,500 20 Mar 2020 41.95 42.07 37.51 38.30 38.30 51,513,500 19 Mar 2020 44.36 44.66 41.04 41.83 41.83 41,956,900 18 Mar 2020 44.74 45.15 41.59 44.85 44.85 35,408,300 17 Mar 2020 45.88 47.50 45.37 47.18 47.18 32,106,700 16 Mar 2020 42.24 47.88 41.17 45.26 45.26 28,682,300 13 Mar 2020 49.51 49.56 46.61 48.47 48.47 33,697,200 13 Mar 2020 0.41 Dividend 12 Mar 2020 48.54 49.93 46.69 47.16 46.75 31,913,100 11 Mar 2020 52.35 52.65 51.14 52.21 51.76 22,653,900 10 Mar 2020 53.22 53.80 51.17 53.66 53.19 27,457,400 09 Mar 2020 52.05 53.58 51.48 51.86 51.41 27,898,300 06 Mar 2020 54.94 55.91 53.98 55.26 54.78 22,353,900 The Coca-Cola Company (ko) NYSE - NYSE Delayed price. Currency in USD Add to watchlist 46.51 -0.16 (-0.34%) 46.50 -0.01 (-0.02%) At close: 4:02PM EDT After hours: 5:06PM EDT Summary Chart Conversations Statistics Historical data Profile Financials Analysis Options Holders Sustainability Previous close 46.67 199.686B 105D 1M 6M YTD 1Y 5Y Max Market cap Beta (5Y monthly) Full screen 49.00 Open 48.50 0.60 Bid 46.30 x 800 PE ratio (TTM) 22.47 48.067 Ask 46.51 x 800 EPS (TTM) 2.07 47.133 Day's range 46.48 - 48.60 46.48 - 48.60 Earnings date Earnings date 21 Apr 2020- 27 Apr 2020 46.48 Forward dividend 52-week range 36.27 -60.13 1.64 (3.51%) & yield Volume 19,210,722 Ex-dividend date 13 Mar 2020 10 16 12 Trade prices are not sourced from all markets Trad Avg. volume 20,072,849 iy target est 54.37 52-Week HILO (Sym) Stock DIV % PE V OL CLOSE NET CHG (End Price-Beg Price) A % Net (CHG/Beg price* 100) 1. A) According to the table above, 's_common stock must have closed at __ per share on the previous trading day. (Closing Price - Previous Day's Price) = (+ or -) Net Change Closing Price (+ or -) Net Change = Previous Day's Price. _'s expected dividend per share? (B) According to the table above, what is_ (Closing Price x Dividend Percentage Yield) 2. Calculate the GROWTH RATE (G) - Use _'s Return on Equity from the Statics page. G= Return on Equity - (DIV/Price) 3. Plowback = EPS-Dividend = 4. Referring to the table above, and the GROWTH RATE from question #2. if we assume that_ forever, what is the required rate of return(K). _'s dividends will grow D. (1+G) + G = Price 5. CAPM = Required Rate of Return (K) = Rf+(R.)Beta = R + (R-R:) Beta. RyRisk free rate; Rm = Market Rate; Rp = Risk Primmum. Assume a Risk Premium of 3 percent, and a Risk-Free Rate of 2 percent RE+ (R-Rt) Beta 6. Based on table above, (EPS = Price/PE) = _'s earnings per share is? (PE = Price/EPS); (EPS = Price/PE) (PE = Price/EPS) = the number of shares that were traded on the 7. Based on the information given in the technical analysis for previous day was: 8. Is ___'s stock overvalued or undervalued? DIV/ROE = $ Price = $ Circle one: OVERVALUED UNDERVALUED Currency in USD Valuation measures Trading information Market cap (intra-day) 5 199.69B Stock price history Beta (5Y monthly) Enterprise value 235.34B 0.60 Trailing P/E 22.47 52-week change 0.00% Forward P/E 1 20.49 -7.45% PEG ratio (5-yr expected) 3.93 60.13 Price/sales (ttm) 5.36 S&P500 52-week change 52-week high 52-week low 50-day moving average 200-day moving average 36.27 Price/book (mra) 10.49 49.91 Enterprise value/revenue 6.32 53.62 Enterprise value/EBITDA 19.63 Share statistics Avg vol (3-month) 20.07M Financial highlights Avg vol (10-day) 20.9M Fiscal year Shares outstanding 4.29B Fiscal year ends 31 Dec 2019 Float 4.26B Most-recent quarter (mra) 31 Dec 2019 % held by insiders ? 0.70% % held by institutions 1 70.68% Profitability Profit margin 23.94% Shares short (13 Mar 2020) 34.52M Operating margin (ttm) 28.51% Short ratio (13 Mar 2020) 4 1.72 Short % of float (13 Mar 2020) 4 0.81% Management effectiveness Return on assets (ttm) 7.83% Short % of shares outstanding (13 Mar 2020) 4 0.80% Return on equity (ttm) 44.75% Shares short (prior month 14 Feb 2020) 38.34M Income statement Revenue (ttm) Dividends & splits Forward annual dividend rate 4 37.27B 1.64 Revenue per share (ttm) 8.72 Forward annual dividend yield 3.51% Quarterly revenue growth (yoy) 16.20% Trailing annual dividend rate 3 1.60 Gross profit (ttm) 22.65B Trailing annual dividend yield> 3.43% EBITDA 11.99B 5-year average dividend yield 4 3.19 Net income avi to common (ttm) 8.92B Payout ratio- 77.29% Diluted EPS (ttm) 2.07 Dividend date > 01 Apr 2020 Quarterly earnings growth (yoy) 134.70% Ex-dividend date 13 Mar 2020 Balance sheet Last split factor 2 2:1 Total cash (mra) 11.19B Last split date > 13 Aug 2012 Total cash per share (mra) 2.61 Total debt (mra) 44.18B Total debt/equity (mra) 209.38 Current ratio (mra) 0.76 Book value per share (mra) 4.43 Cash flow statement Operating cash flow (ttm) 10.47B Levered free cash flow (ttm) 6.65B Date Open High Low Close Adj. close** Volume 07 Apr 2020 48.50 48.60 46.48 46.51 46.51 19,210,722 06 Apr 2020 45.39 47.01 44.69 46.67 46.67 22,844,600 03 Apr 2020 43.58 44.34 43.31 43.83 43.83 14,207,100 02 Apr 2020 42.22 44.19 41.86 43.95 43.95 17,621,900 01 Apr 2020 42.48 43.65 41.80 42.12 42.12 21,936,400 31 Mar 2020 45.07 45.51 44.06 44.25 44.25 25,373,900 30 Mar 2020 43.04 45.56 43.04 45.00 45.00 23,446,000 27 Mar 2020 43.66 44.03 42.40 42.81 42.81 23,297,900 26 Mar 2020 42.84 45.27 42.45 44.29 44.29 37,821,700 25 Mar 2020 40.63 43.45 39.91 41.61 41.61 42,511,700 24 Mar 2020 41.22 41.40 38.83 39.45 39.45 49,096,200 23 Mar 2020 38.76 38.89 36.27 37.56 37.56 44,978,500 20 Mar 2020 41.95 42.07 37.51 38.30 38.30 51,513,500 19 Mar 2020 44.36 44.66 41.04 41.83 41.83 41,956,900 18 Mar 2020 44.74 45.15 41.59 44.85 44.85 35,408,300 17 Mar 2020 45.88 47.50 45.37 47.18 47.18 32,106,700 16 Mar 2020 42.24 47.88 41.17 45.26 45.26 28,682,300 13 Mar 2020 49.51 49.56 46.61 48.47 48.47 33,697,200 13 Mar 2020 0.41 Dividend 12 Mar 2020 48.54 49.93 46.69 47.16 46.75 31,913,100 11 Mar 2020 52.35 52.65 51.14 52.21 51.76 22,653,900 10 Mar 2020 53.22 53.80 51.17 53.66 53.19 27,457,400 09 Mar 2020 52.05 53.58 51.48 51.86 51.41 27,898,300 06 Mar 2020 54.94 55.91 53.98 55.26 54.78 22,353,900 The Coca-Cola Company (ko) NYSE - NYSE Delayed price. Currency in USD Add to watchlist 46.51 -0.16 (-0.34%) 46.50 -0.01 (-0.02%) At close: 4:02PM EDT After hours: 5:06PM EDT Summary Chart Conversations Statistics Historical data Profile Financials Analysis Options Holders Sustainability Previous close 46.67 199.686B 105D 1M 6M YTD 1Y 5Y Max Market cap Beta (5Y monthly) Full screen 49.00 Open 48.50 0.60 Bid 46.30 x 800 PE ratio (TTM) 22.47 48.067 Ask 46.51 x 800 EPS (TTM) 2.07 47.133 Day's range 46.48 - 48.60 46.48 - 48.60 Earnings date Earnings date 21 Apr 2020- 27 Apr 2020 46.48 Forward dividend 52-week range 36.27 -60.13 1.64 (3.51%) & yield Volume 19,210,722 Ex-dividend date 13 Mar 2020 10 16 12 Trade prices are not sourced from all markets Trad Avg. volume 20,072,849 iy target est 54.37
Step by Step Solution
There are 3 Steps involved in it

Get step-by-step solutions from verified subject matter experts