

Question: 5.31 ... cil cl 1 No Spac... Heading 1 Heading 2 Subtitle 1 Normal Title Subtle E Paragraph Styles QUALITY Assignments Name Student ID Number
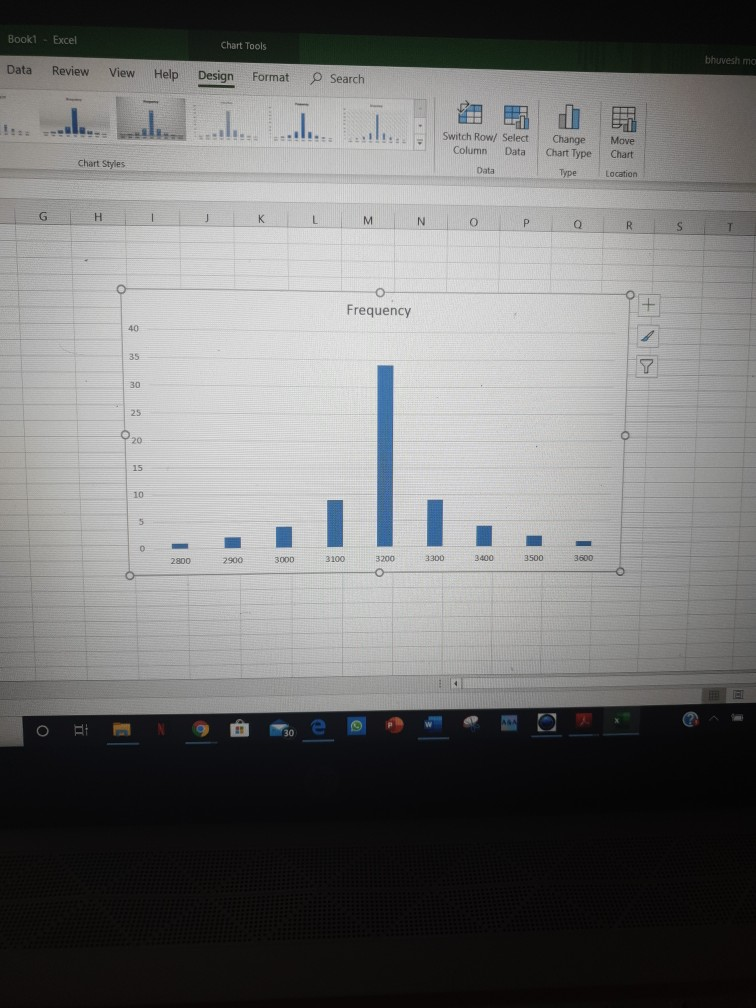
5.31 ... cil cl 1 No Spac... Heading 1 Heading 2 Subtitle 1 Normal Title Subtle E Paragraph Styles QUALITY Assignments Name Student ID Number Assignment # 3 The light output color of Light Emitting Diode (LED) devices shipped by the supplier, CREE varies according to a normal distribution with a Mean at 3200K and Standard Deviation of 150K. The attached data is the LED chips color measurements with the last shipment. 1. Calculate the mean and standard deviation for the provided measurement data set. (1 mark) 2- How far is your calculation results from the proposed mean and SD values by the supplier? What is the reason for the difference? 3- Create a Histogram showing the distribution of the LED chips color with this shipment. (2 mark) 4- LED Chips are acceptable for producing lightbulbs if their light output color is equal to or greater than 3050K. Use the empirical rule to estimate the percentage of the LED chips that are acceptable for use with production. (2 mark) Book1 - Excel Chart Tools bhuvesh ma Data Review View Help Design Format Search ........ Switch Row/ Select Column Data Change Chart Type Move Chart Chart Styles Data Type Location G H 1 K L M N O Q R S 1 Frequency + 40 35 Y 30 25 P20 15 10 5 0 - 2900 2900 3000 3100 3200 3300 3400 3500 3600 Allt 30 5.31 ... cil cl 1 No Spac... Heading 1 Heading 2 Subtitle 1 Normal Title Subtle E Paragraph Styles QUALITY Assignments Name Student ID Number Assignment # 3 The light output color of Light Emitting Diode (LED) devices shipped by the supplier, CREE varies according to a normal distribution with a Mean at 3200K and Standard Deviation of 150K. The attached data is the LED chips color measurements with the last shipment. 1. Calculate the mean and standard deviation for the provided measurement data set. (1 mark) 2- How far is your calculation results from the proposed mean and SD values by the supplier? What is the reason for the difference? 3- Create a Histogram showing the distribution of the LED chips color with this shipment. (2 mark) 4- LED Chips are acceptable for producing lightbulbs if their light output color is equal to or greater than 3050K. Use the empirical rule to estimate the percentage of the LED chips that are acceptable for use with production. (2 mark) Book1 - Excel Chart Tools bhuvesh ma Data Review View Help Design Format Search ........ Switch Row/ Select Column Data Change Chart Type Move Chart Chart Styles Data Type Location G H 1 K L M N O Q R S 1 Frequency + 40 35 Y 30 25 P20 15 10 5 0 - 2900 2900 3000 3100 3200 3300 3400 3500 3600 Allt 30
Step by Step Solution
There are 3 Steps involved in it

Get step-by-step solutions from verified subject matter experts