

Question: 54. [-/4 Points] DETAILS ROLFFM8 8.1.005. MY NOTES ASK YOUR TEACHER PRACTICE ANOTHER Make a stem-and-leaf plot for the given scores. 20, 39, 55, 29,
![54. [-/4 Points] DETAILS ROLFFM8 8.1.005. MY NOTES ASK YOUR TEACHER](https://s3.amazonaws.com/si.experts.images/answers/2024/06/667d8d22ba789_162667d8d2286aad.jpg)
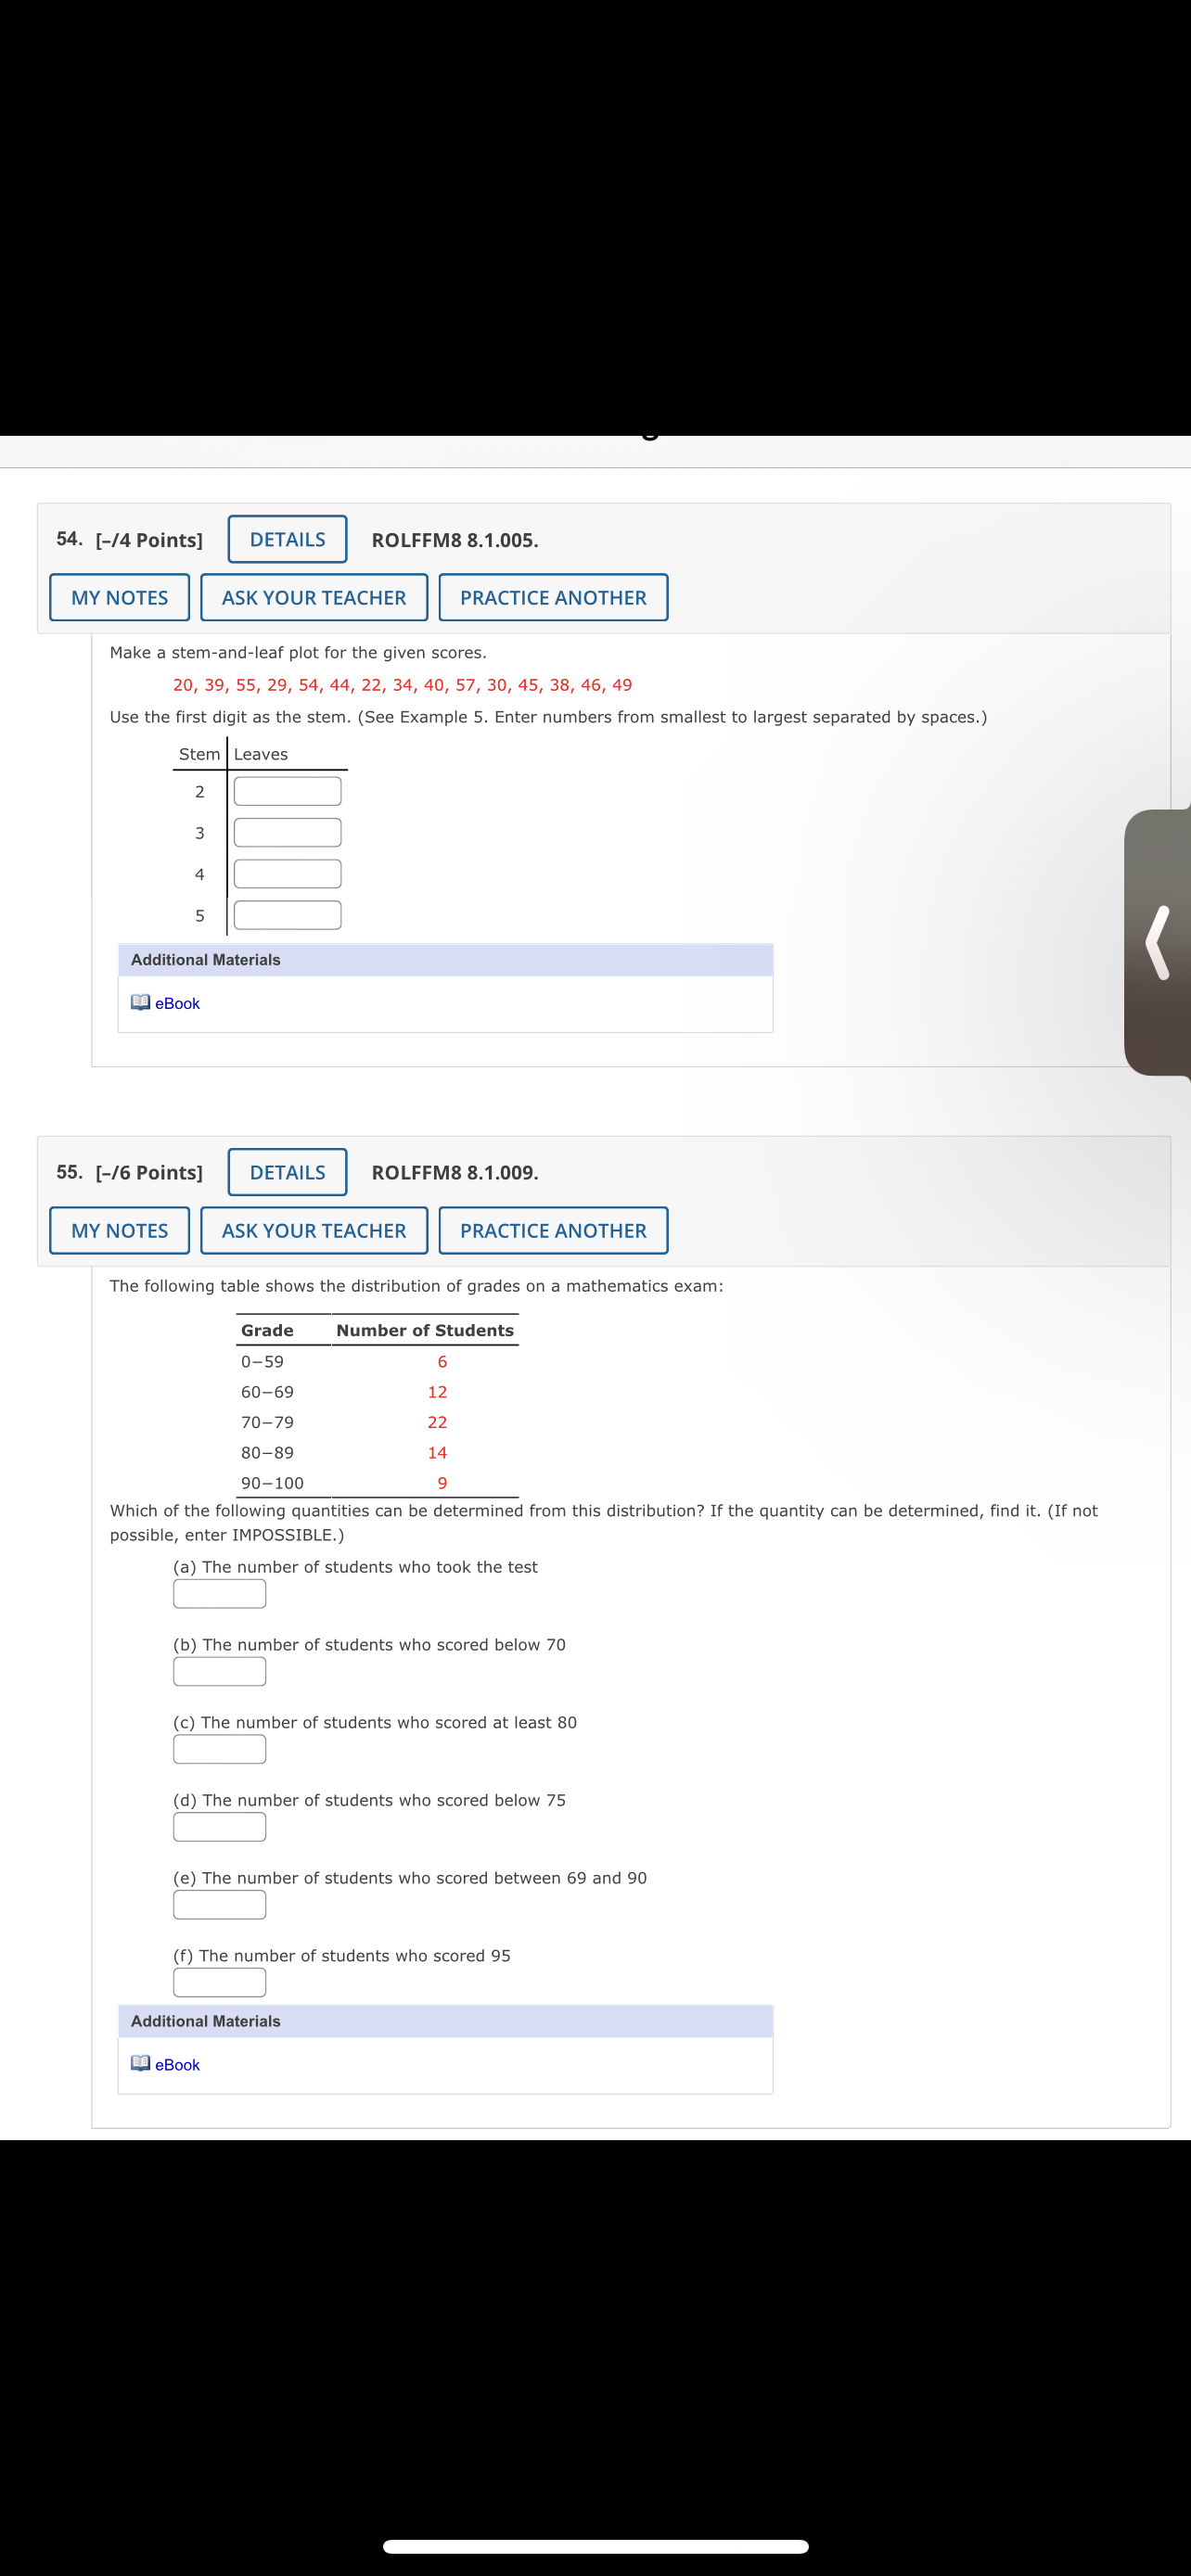
54. [-/4 Points] DETAILS ROLFFM8 8.1.005. MY NOTES ASK YOUR TEACHER PRACTICE ANOTHER Make a stem-and-leaf plot for the given scores. 20, 39, 55, 29, 54, 44, 22, 34, 40, 57, 30, 45, 38, 46, 49 Use the first digit as the stem. (See Example 5. Enter numbers from smallest to largest separated by spaces.) Stem Leaves W 4 5 Additional Materials eBook 55. [-/6 Points] DETAILS ROLFFM8 8.1.009. MY NOTES ASK YOUR TEACHER PRACTICE ANOTHER The following table shows the distribution of grades on a mathematics exam: Grade Number of Students 0-59 6 60-69 12 70-79 22 80-89 14 90-100 Which of the following quantities can be determined from this distribution? If the quantity can be determined, find it. (If not possible, enter IMPOSSIBLE.) (a) The number of students who took the test (b) The number of students who scored below 70 (c) The number of students who scored at least 80 (d) The number of students who scored below 75 (e) The number of students who scored between 69 and 90 (f) The number of students who scored 95 Additional Materials eBook
Step by Step Solution
There are 3 Steps involved in it

Get step-by-step solutions from verified subject matter experts