

Question: 5.4 (a) Write a program that creates the grid and then makes a mesh plot and a surf plot of the function Z X*Y
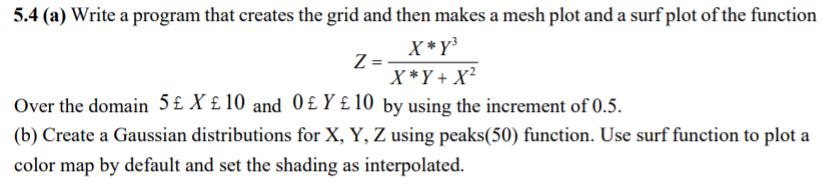
5.4 (a) Write a program that creates the grid and then makes a mesh plot and a surf plot of the function Z X*Y X*Y+X2 Over the domain 5X10 and 0 Y 10 by using the increment of 0.5. (b) Create a Gaussian distributions for X, Y, Z using peaks(50) function. Use surf function to plot a color map by default and set the shading as interpolated.
Step by Step Solution
There are 3 Steps involved in it
1 Expert Approved Answer
Step: 1 Unlock

Heres a Python program using matplotlib and numpy to accomplish the tasks described import numpy as ... View full answer
Question Has Been Solved by an Expert!
Get step-by-step solutions from verified subject matter experts
Step: 2 Unlock
Step: 3 Unlock