

Question: 5.5 Table 5.15 shows a regression output obtained from fitting the model Y = Bo + BX + to a set of data consisting
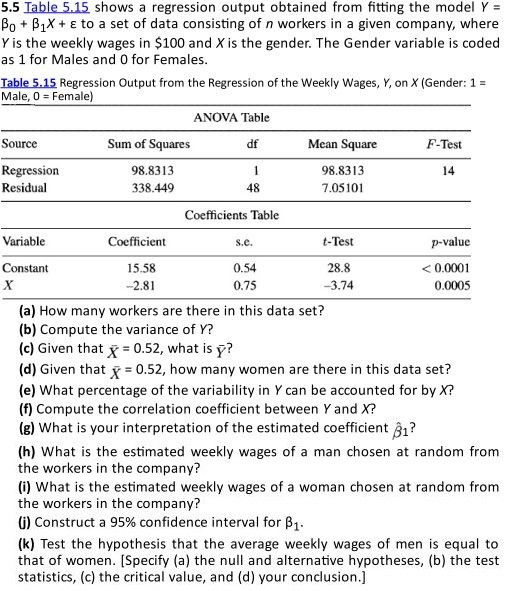
5.5 Table 5.15 shows a regression output obtained from fitting the model Y = Bo + BX + to a set of data consisting of n workers in a given company, where Y is the weekly wages in $100 and X is the gender. The Gender variable is coded as 1 for Males and 0 for Females. Table 5.15 Regression Output from the Regression of the Weekly Wages, Y, on X (Gender: 1 = Male, 0 = Female) Source Regression Residual Variable Constant X Sum of Squares 98.8313. 338.449 Coefficient 15.58 -2.81 ANOVA Table df 1 48 Coefficients Table s.e. 0.54 0.75 Mean Square 98.8313 7.05101 t-Test 28.8 -3.74 F-Test 14 p-value
Step by Step Solution
3.44 Rating (157 Votes )
There are 3 Steps involved in it
To tackle these questions well analyze the regression output and answer each part step by step a How many workers are there in this data set The total ... View full answer

Get step-by-step solutions from verified subject matter experts