

Question: 5.5.2 Map out systemic change required to achieve goals For each of the three goals: [OBJ-06] Identify the key variables or factors that make up
5.5.2 Map out systemic change required to achieve goals For each of the three goals:
[OBJ-06] Identify the key variables or factors that make up the goal issue by considering the two systemic theories of change (success amplification theory and correct an existing situation; Stroh, 2015; p 169-172) to introduce the dynamics of reinforcing and balancing loops. For each variable, identify which factors are internal for KPH, and which are external.
[OBJ-07] Apply the causal loop diagram structure
[OBJ-08] Identify (by labelling in accordance with good causal loop diagram mapping practices) and explain (by way of an accompanying text description) the feedback loops depicted in the causal loop diagrams. The causal loop diagram represents a roadmap for the future.
5.5.3 Use the future roadmap to explore connections and identify leverage points [OBJ-09] Analyse the three roadmaps to explore possible interconnections among maps (e.g., common dynamics that may help realise the three goals). Merge the roadmaps where you see possible connections. Explain the connections between roadmaps. Investigate the roadmap to identify leverage points to achieve goals. Tip: You may need to add more variables/factors to see connections. Justify your additions. Tip: Connections between maps that appear to be unlikely, unnatural, or illogical will be scored lower than those that appear to be plausible.
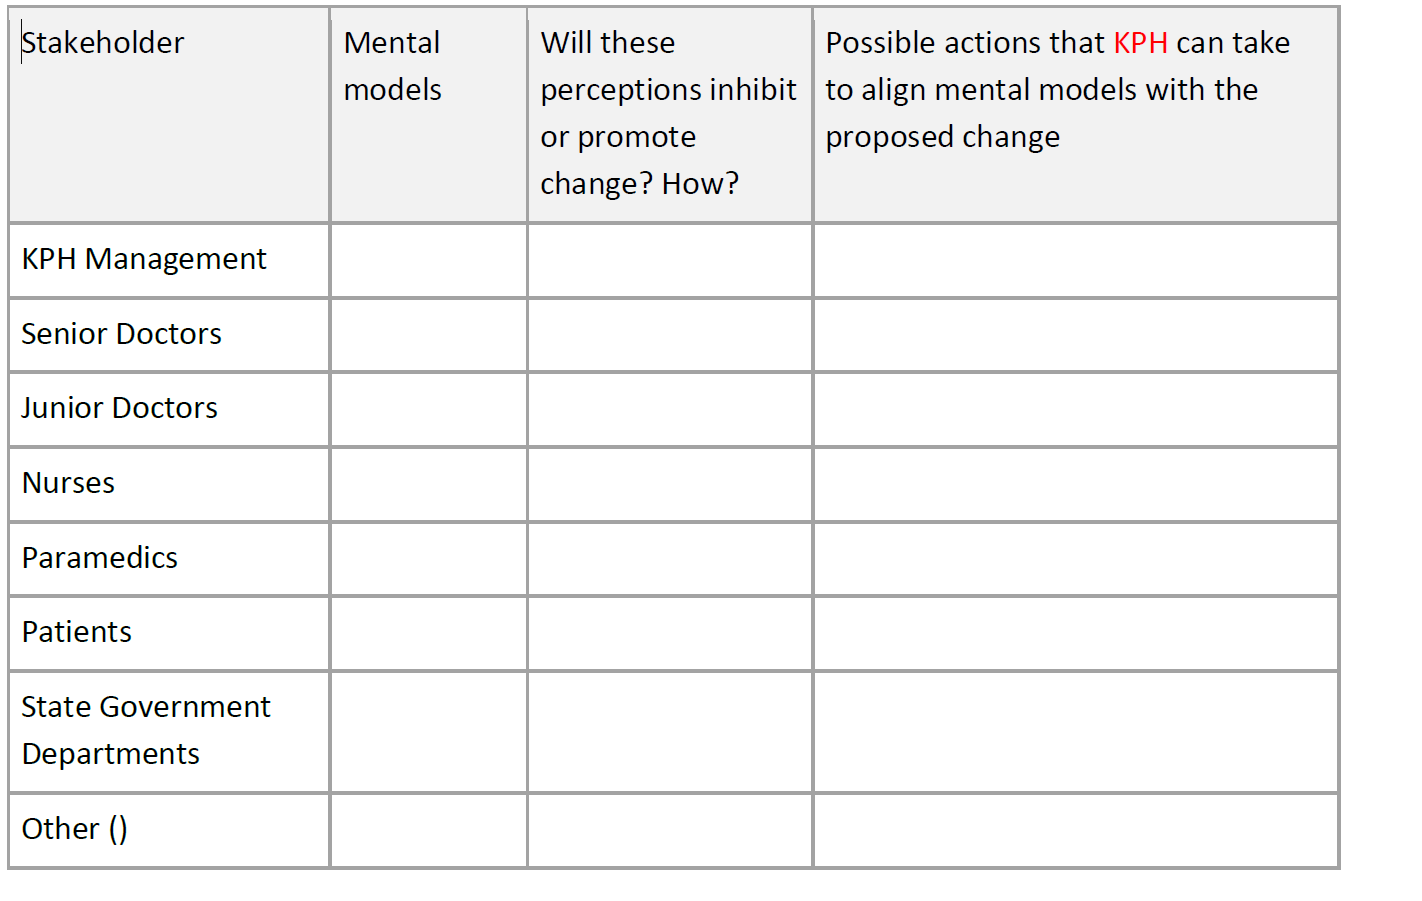
5.5.4 Surface mental models about the proposed systemic change [OBJ-05] For each of the three goals, analyse each of the stakeholders (listed in the following table) in order to describe their respective mental models about the proposed change which may inhibit or promote the proposed change and unanticipated effects. For those perceptions which may inhibit the change, propose possible actions that KPH can take for the stakeholder group to be promoting the change instead (i.e., aligned with the proposed change). Tip: Use the following table to present your results in the report. Tip: In the Other row, add any stakeholder group that you think relevant to the goal issue that may not be already included. Tip: If you think a particular stakeholder group is irrelevant to the systemic change, highlight as irrelevant and explain why you think so.
5.5.5 Visualise the physics of the proposed change and leverage points 1. [OBJ-12] In preparation of creating a stock and flow diagram for each goal, identify, define, and classify variables according to their function in the system (i.e., stocks, flows), and their unit of measurement. Present this in a table format. Consider the results from tasks described by section 5.5.3 and 5.5.4 above. 2. [OBJ-13] Using the Systems Dynamics library in the Anylogic Software (Personal Education License), or Vensim create a stock and flow diagram for each goal to visualise the mechanics of achieving the stated goal. Identify clearly on the diagrams flows what will be targeted to achieve the desirable change. 3. [OBJ-14] Analyse the stock and flow diagrams to describe (in 1 to 2 paragraphs) the flows and variables to be targeted to achieve the goals. Tip: Remember that stocks and connected flows MUST have the same units.
Step by Step Solution
There are 3 Steps involved in it

Get step-by-step solutions from verified subject matter experts