

Question: 57-1 Finding Financial Information [LO 7-2, LO 7-4, LO 7-5) Refer to the financial statements of The Home Depot in Appendix A. (Note: Fiscal 2019
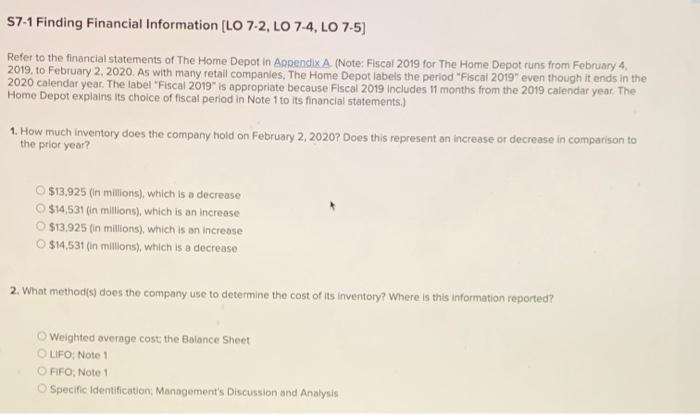
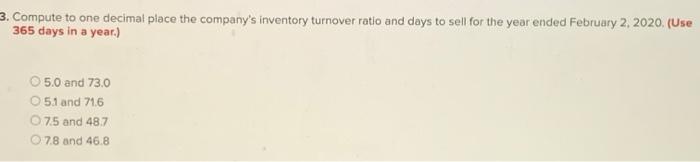
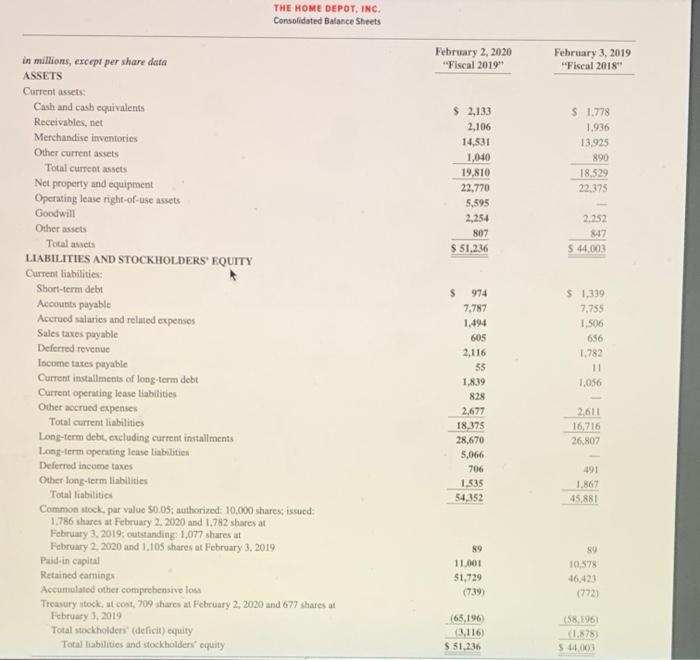
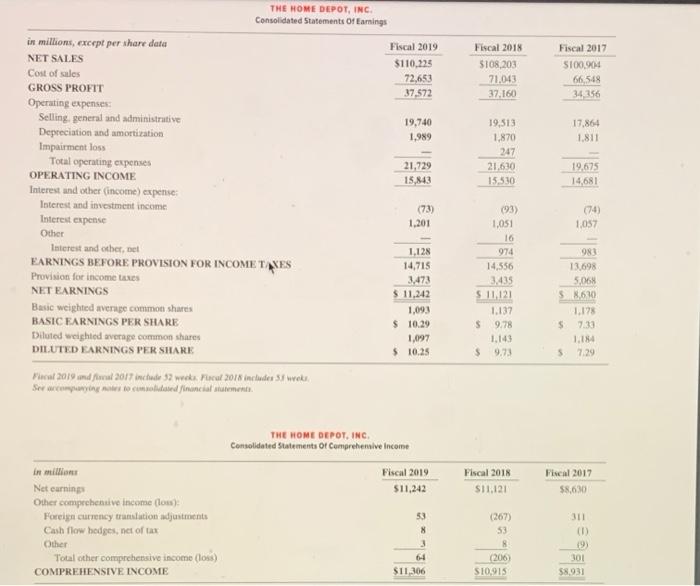
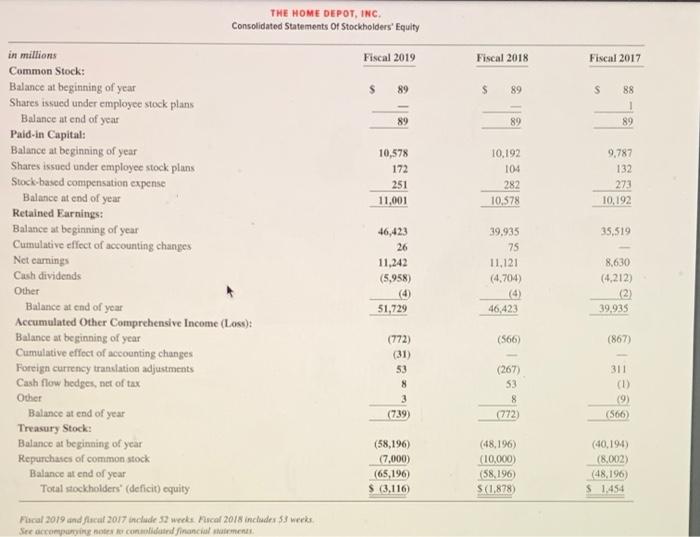
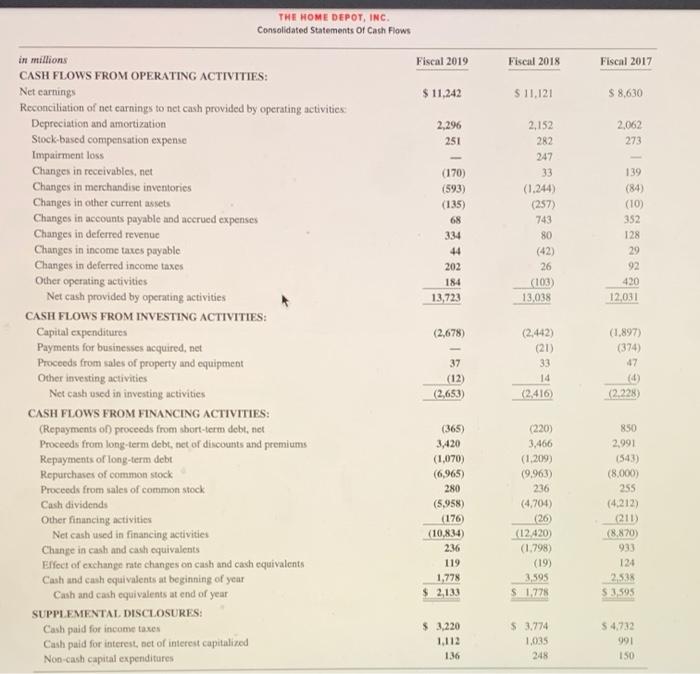
57-1 Finding Financial Information [LO 7-2, LO 7-4, LO 7-5) Refer to the financial statements of The Home Depot in Appendix A. (Note: Fiscal 2019 for The Home Depot runs from February 4 2019 to February 2, 2020. As with many retail companies, The Home Depot labels the period "Fiscal 2019" even though it ends in the 2020 calendar year. The label "Fiscal 2019" is appropriate because Fiscal 2019 includes 11 months from the 2019 calendar year. The Home Depot explains its choice of fiscal period in Note 1 to its financial statements.) 1. How much Inventory does the company hold on February 2, 2020? Does this represent an increase or decrease in comparison to the prior year? $13,925 (in millions), which is a decrease $14,531 (in millions), which is an increase $13.925 (in millions), which is an increase O $14,531 (in millions), which is a decrease 2. What method(s) does the company use to determine the cost of its inventory? Where is this information reported? Weighted average cost; the Balance Sheet LIFO: Note 1 OFFO; Note 1 Specific Identification Management's Discussion and Analysis 3. Compute to one decimal place the company's inventory turnover ratio and days to sell for the year ended February 2, 2020. (Use 365 days in a year.) 5.0 and 73.0 5.1 and 71.6 7.5 and 487 0.78 and 46.8 THE HOME DEPOT, INC. Consolidated Balance Sheets February 2, 2020 "Fiscal 2019" February 3, 2019 "Fiscal 2018" $ 2,133 2,106 14,531 1,040 19,810 22,770 5,595 2,254 807 $51.236 $ 1.778 1.936 13.925 890 18.529 22.373 2.252 847 $ 44,003 in millions, except per share data ASSETS Current assets Cash and cash equivalents Receivables, net Merchandise inventories Other current assets Total current assets Net property and equipment Operating lease right-of-use assets Goodwill Other assets Total assets LIABILITIES AND STOCKHOLDERS' EQUITY Current liabilities: Short-term debt Accounts payable Accrued salaries and related expenses Sales taxes payable Deferred revenue Income taxes payable Current installments of long-term debt Current operating lease liabilities Other accrued expenses Total current liabilities Long-term debt, excluding current installments Long-term operating lease liabilities Deferred income taxes Other long-term liabilities Total liabilities Common stock, par value 50.05; authorized: 10,000 shares, issued 1.786 shares at February 2, 2020 and 1.782 shares at February 3, 2019. outstanding: 1,077 shares at February 2, 2020 and 1,105 shares at February 3, 2019 Pald.in capital Retained earnings Accumulated other comprehensive loss Treasury stock, ut cont, 709 shares at February 2, 2020 and 677 shares at February 3, 2019 Total stockholders (deficit) equity Total liabilities and stockholders' equity $1,319 7,755 1.506 656 1.782 11 1,056 $ 974 7.787 1.494 605 2,116 53 1.839 828 2,677 18,375 28,670 5,066 706 1,535 54,352 2,611 16,716 26,807 491 1.867 45.881 89 11.001 $1,729 (739) SO 10,578 46,423 (772) (65,196) (3,116) $ 51,236 (58.196) (1.878) 5.44003 THE HOME DEPOT, INC. Consolidated Statements Of Earnings Fiscal 2019 $110,225 72,653 37.572 Fiscal 2018 $108,203 71,043 37,160 Fiscal 2017 5100,904 66,548 34256 19,740 1,989 17.864 1.811 19,513 1,870 247 21.630 15510 21,729 15,843 19.673 14,681 in millions, except per share data NET SALES Cost of sales GROSS PROFIT Operating expenses Selling, general and administrative Depreciation and amortization Impairment loss Total operating expenses OPERATING INCOME Interest and other (income) expense Interest and investment income Interest expense Other Interest and other, bet EARNINGS BEFORE PROVISION FOR INCOME TAXES Provision for income taxes NET EARNINGS Basic weighted average common shares BASIC EARNINGS PER SHARE Diluted weighted average common shares DILUTED EARNINGS PER SHARE ca 2019 and 2017 inchado 52 week. Pol 2018 includes 5 weki Ser coming to come inancial sement (73) 1,201 Es (74) 1,057 1,128 14,715 3,473 $ 11,242 1,093 $ 10.29 1,097 $ 10.25 093) 1,051 16 974 14,556 3.435 5 11.121 1.137 $ 9.78 1.143 $ 9.73 983 13.698 5,068 58610 1,178 s 7.30 1.184 5729 THE HOME DEPOT, INC Consolidated Statements Of Comprehensive Income Fiscal 2019 $11.242 Fiscal 2018 S11,121 Fiscal 2017 58,630 In allian Net earning Other compechentive income (los) Foreign currency tratilation adjustments Cash flow bodges, net of tax Other Total other comprehensive income (los) COMPREHENSIVE INCOME 33 8 3 64 $11,306 (267) 53 8 (206) S10,915 311 (1 19) 301 $8.931 THE HOME DEPOT, INC Consolidated Statements Of Stockholders' Equity Fiscal 2019 Fiscal 2018 Fiscal 2017 89 s 88 313 89 10,192 104 10,578 172 251 11,001 9,787 132 273 10,192 282 10,578 35,519 in millions Common Stock: Balance at beginning of year Shares issued under employee stock plans Balance at end of year Paid-in Capital: Balance at beginning of year Shares issued under employee stock plans Stock-based compensation expense Balance at end of year Retained Earnings: Balance at beginning of year Cumulative effect of accounting changes Nct earnings Cash dividends Other Balance at end of your Accumulated Other Comprehensive Income (Loss): Balance at beginning of year Cumulative effect of accounting changes Foreign currency translation adjustments Cash flow hedges, net of tax Other Balance at end of year Treasury Stock: Balance at beginning of year Repurchases of common stock Balance at end of year Total stockholders' (deficit) equity 46,423 26 11,242 (5,958) 39.935 75 11.121 (4.704) (4) 46,423 8.630 (4,212) (2) 39,935 51,729 (566) (867) (772) (31) 53 8 3 (739 (267) 53 8 (772) 311 (1) (9) (566 (58,196) (7.000) (65,196) $ (3,116 (48,196) (10,000) (58.196 5.(1,878 (40,194) (8.002) (48,196 $1.454 Pascal 2019 and flatut 2017 include 52 weeks Racal 2018 includes 53 works. See accomo consolidated financial statements THE HOME DEPOT, INC. Consolidated Statements of Cash Flows Fiscal 2019 Fiscal 2018 Fiscal 2017 $ 11,242 S 11,121 $ 8,630 2,296 251 2,062 273 2,152 282 247 33 (1.244) (257) 139 (170) (593) (135) 68 334 44 202 743 80 (42) 26 (103) 13,038 (10) 352 128 29 92 420 12,031 184 13,723 (2,678) in millions CASH FLOWS FROM OPERATING ACTIVITIES: Net earnings Reconciliation of net carnings to net cash provided by operating activities Depreciation and amortization Stock-based compensation expense Impairment loss Changes in receivables, net Changes in merchandise inventories Changes in other current assets Changes in accounts payable and accrued expenses Changes in deferred revenue Changes in income taxes payable Changes in deferred income taxes Other operating activities Net cash provided by operating activities CASH FLOWS FROM INVESTING ACTIVITIES: Capital expenditures Payments for businesses acquired, net Proceeds from sales of property and equipment Other investing activities Net cash used in investing activities CASH FLOWS FROM FINANCING ACTIVITIES: (Repayments of) proceeds from short-term debt, niet Proceeds from long-term debt, net of discounts and premiums Repayments of long-term debt Repurchases of common stock Proceeds from sales of common stock Cash dividende Other financing activities Net cash used in financing activities Change in cash and cash equivalents Elfoct of exchange rate changes on cash and cash equivalents Cash and cash equivalents at beginning of your Cash and cash equivalents at end of year SUPPLEMENTAL DISCLOSURES: Cash paid for income taxes Cash paid for interest, net of interest capitalized Non cash capital expenditures (2,442) (21) 33 14 (2416) (1.897) (374) 47 37 (12) (2,653) (2.228 (220) 3.466 (1.209) (9.963) 236 (365) 3,420 (1.070) (6,965) 280 (5,958) (176) (10,834) 236 119 1,778 2,133 (4,704) (26) (12.420) (1.798) (19) 3,595 51.778 850 2,991 (543) (8,000) 255 (4.212) (211) (8.870) 933 124 2.538 $ 3.595 $ 3.220 1,112 136 $ 3.774 1,035 248 54,732 991 ISO
Step by Step Solution
There are 3 Steps involved in it

Get step-by-step solutions from verified subject matter experts