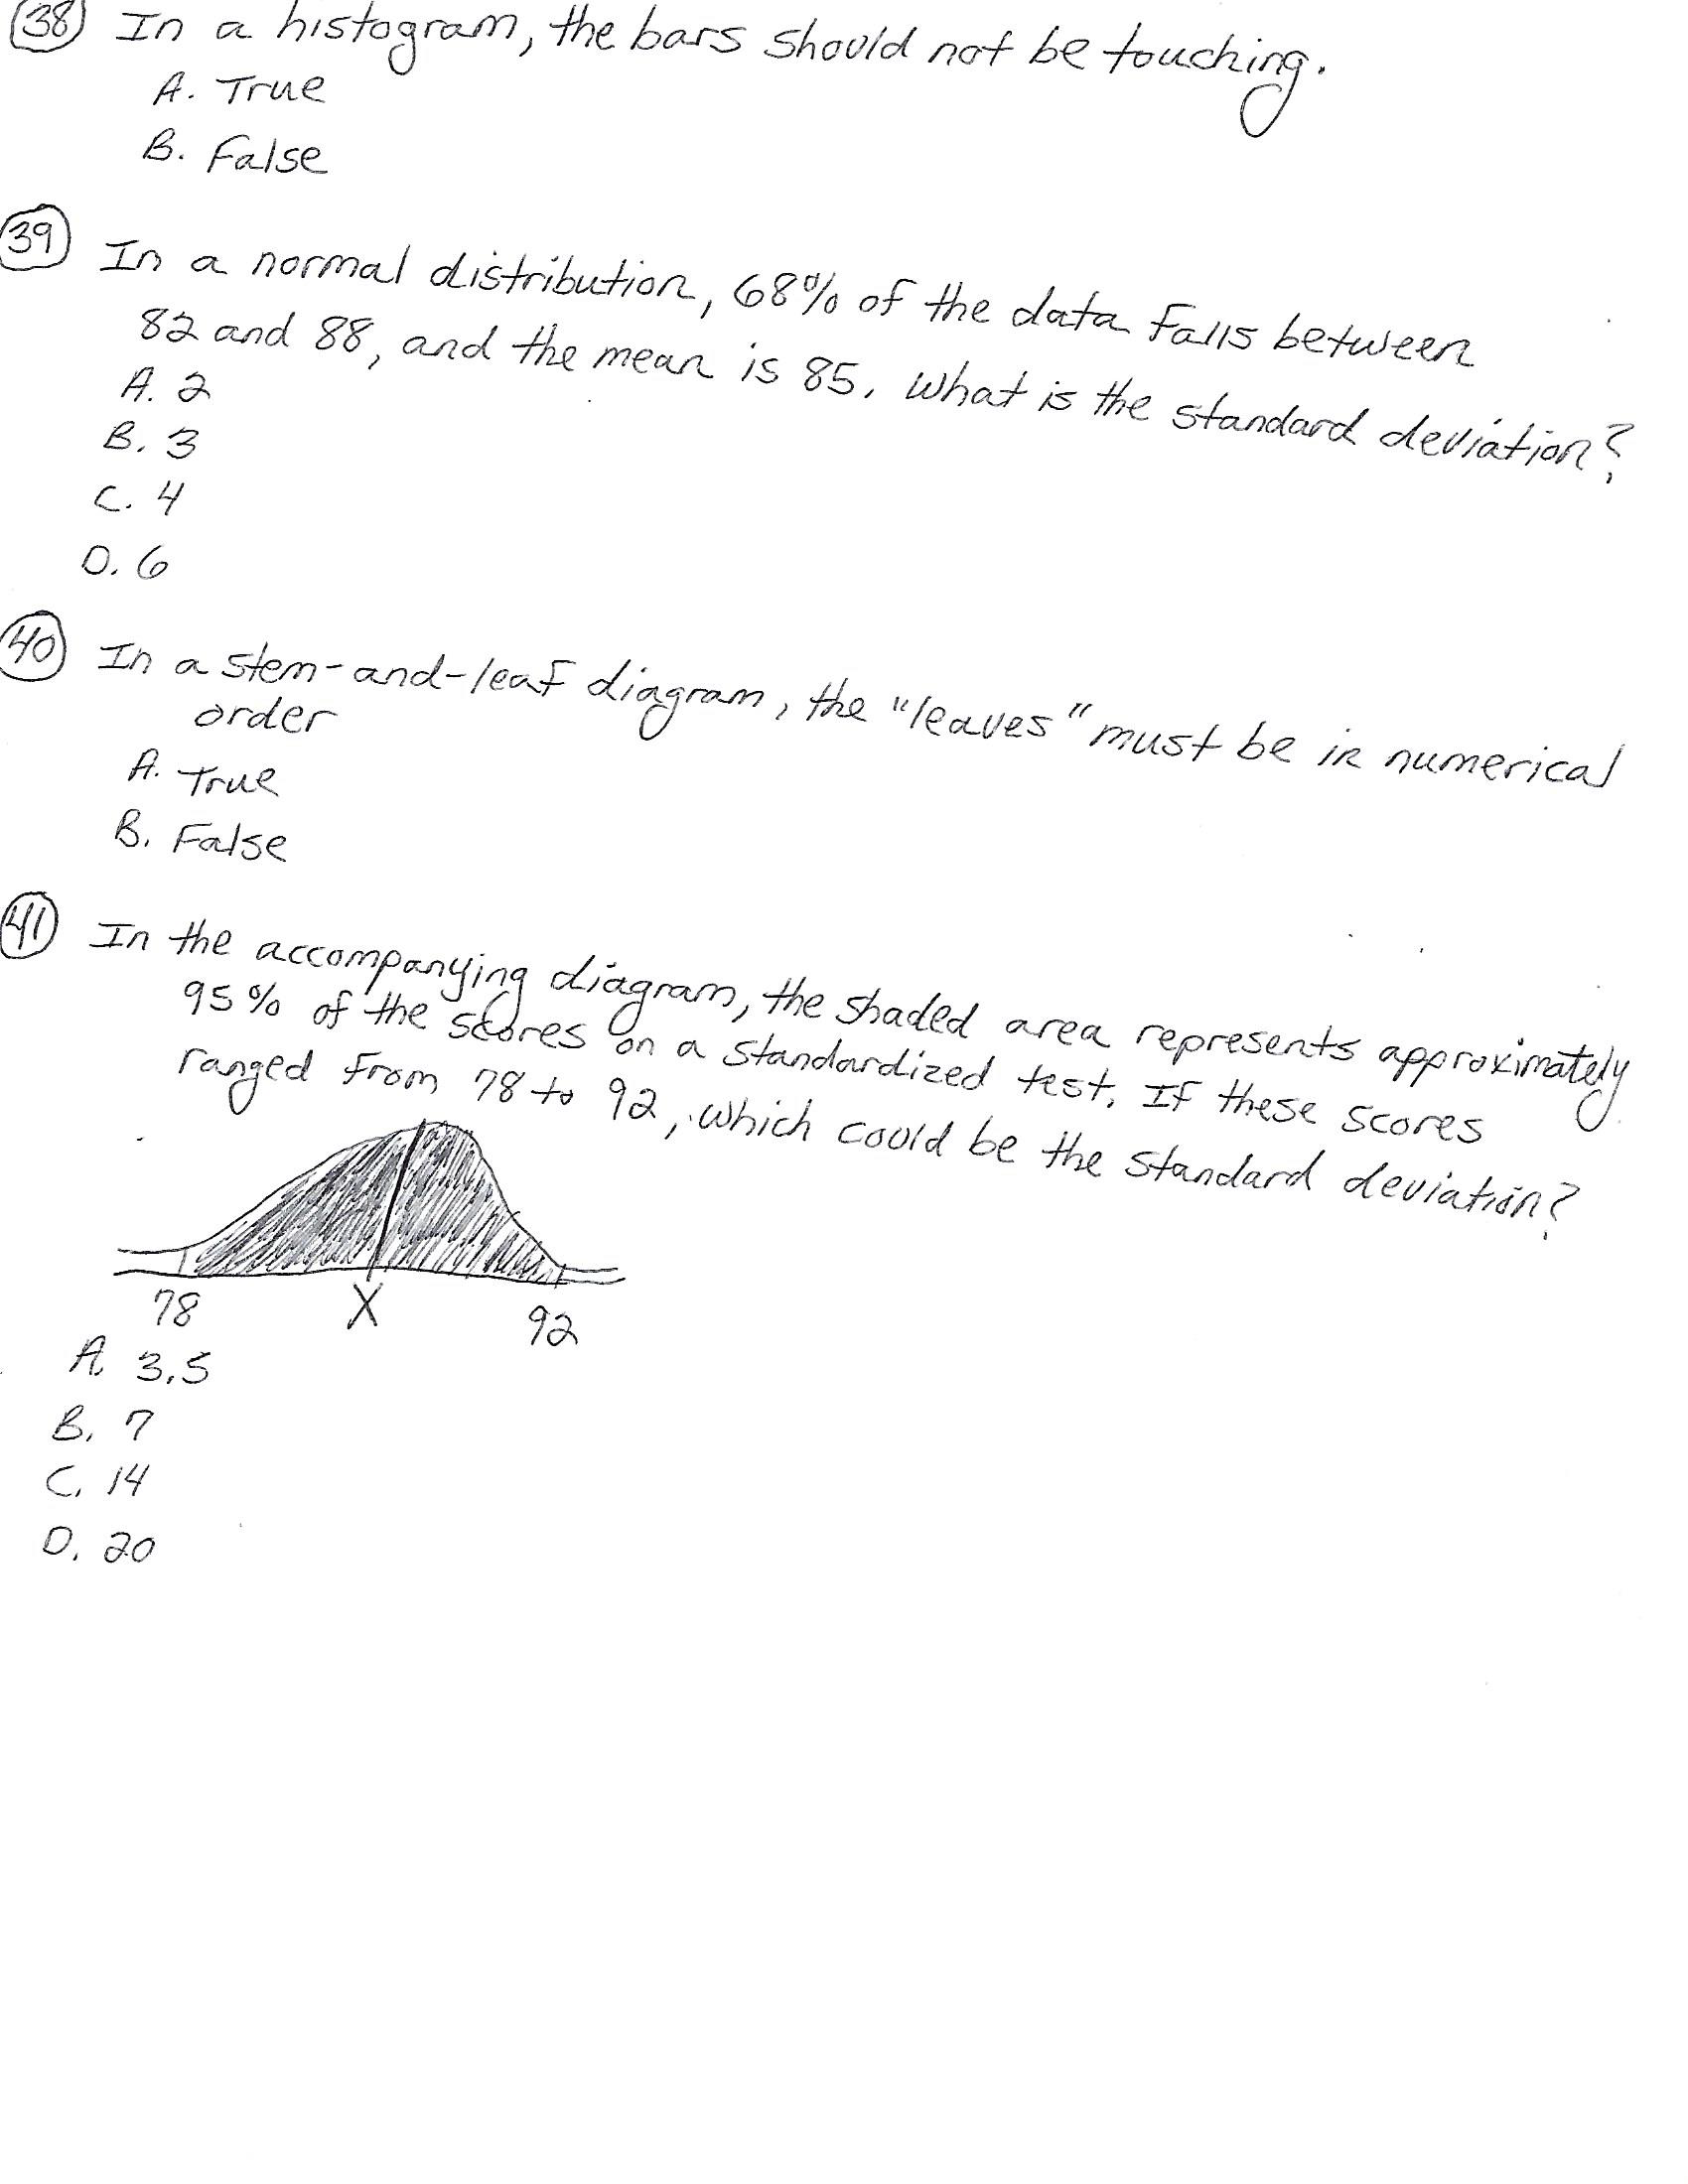
Question: 58 In a histogram, the bars should not be touching. A. True B. False 39 In a normal distribution , 68 %% of the data

58 In a histogram, the bars should not be
58 In a histogram, the bars should not be touching. A. True B. False 39 In a normal distribution , 68 %% of the data Falls between 8 2 and 88 , and the mean is 85 , What is the standard deviation , A. 2 B. 3 C. 4 0. 6 HO In a stem- and-leaf diagram , the " leaves " must be in numerical order A. True B. False In the accompanying diagram, the shaded area represents approximately 95 % of the scores on a standardized test, If these scores ranged From 78 to 92 , which could be the standard deviation? 78 92 A 3.5 B. 7 C, 14 D. 20

Step by Step Solution

There are 3 Steps involved in it

1 Expert Approved Answer
Step: 1 Unlock blur-text-image
Question Has Been Solved by an Expert!

Get step-by-step solutions from verified subject matter experts

Step: 2 Unlock
Step: 3 Unlock

Students Have Also Explored These Related Mathematics Questions!