

Question: 58. The following data matrix represents the average exam score for students who study and those who do not at different levels of attendance: Attendance
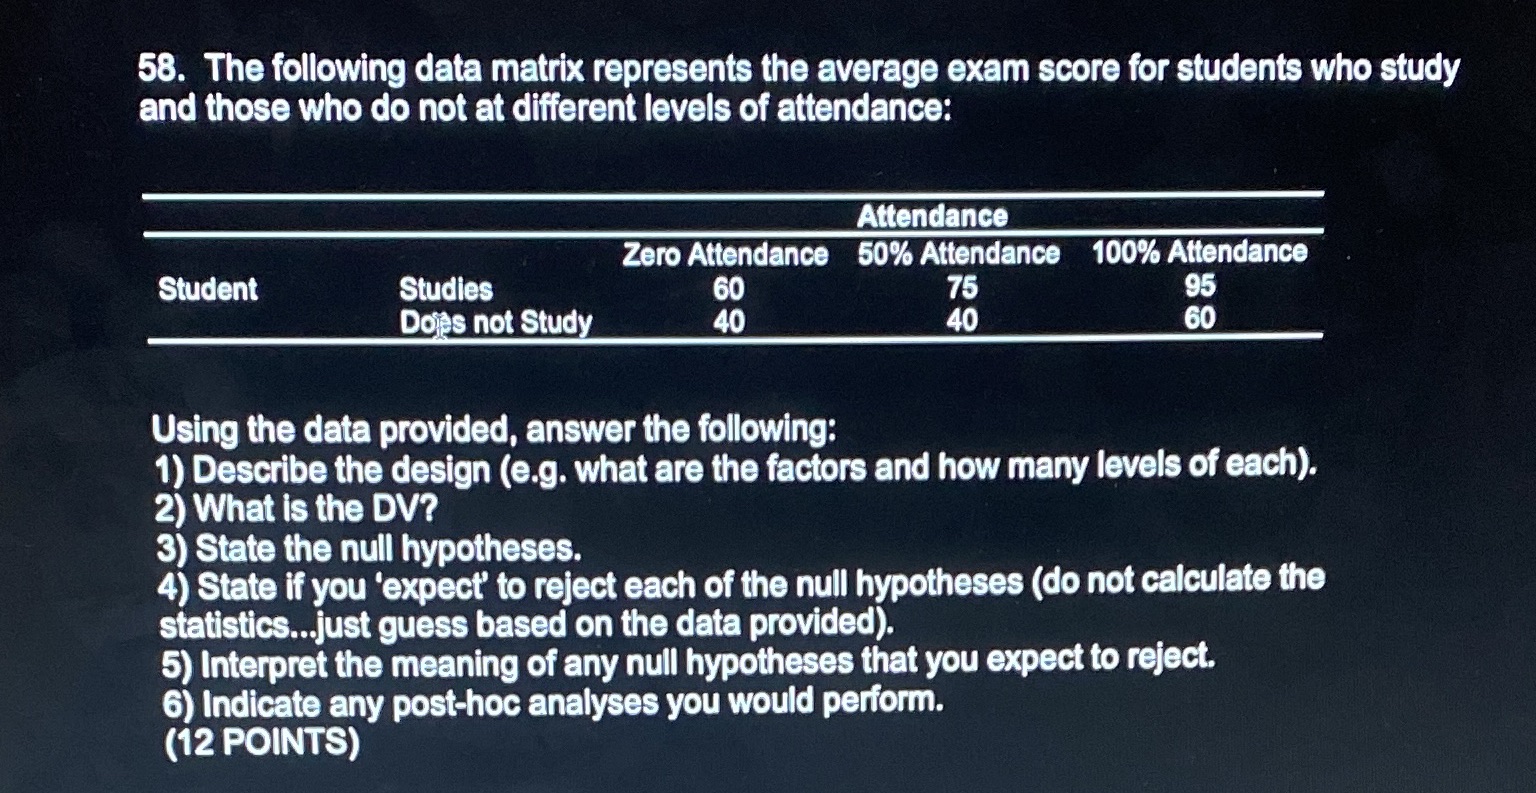
58. The following data matrix represents the average exam score for students who study and those who do not at different levels of attendance: Attendance Zero Attendance 50% Attendance 100% Attendance Student Studies 60 75 95 Dogs not Study 40 4O 60 Using the data provided. answer the following: 1) Describe the design (e.g. what are the factors and how many levels of each). 2) What is the DV'? 3) State the null hypotheses. 4) State if you 'expect' to reject each of the null hypotheses (do not calculate the statistics...just guess based on the data provided). 5) Interpret the meaning of any null hypotheses that you expect to reject. 6) Indicate any post'hoc analyses you would perform. (12 POINTS)
Step by Step Solution
There are 3 Steps involved in it

Get step-by-step solutions from verified subject matter experts