

Question: 5.Estimate the value of r based on the scatterplot above. Section 1 | High Level Overview Please note: For financials, millions are reported in thousands
5.Estimate the value of r based on the scatterplot above.
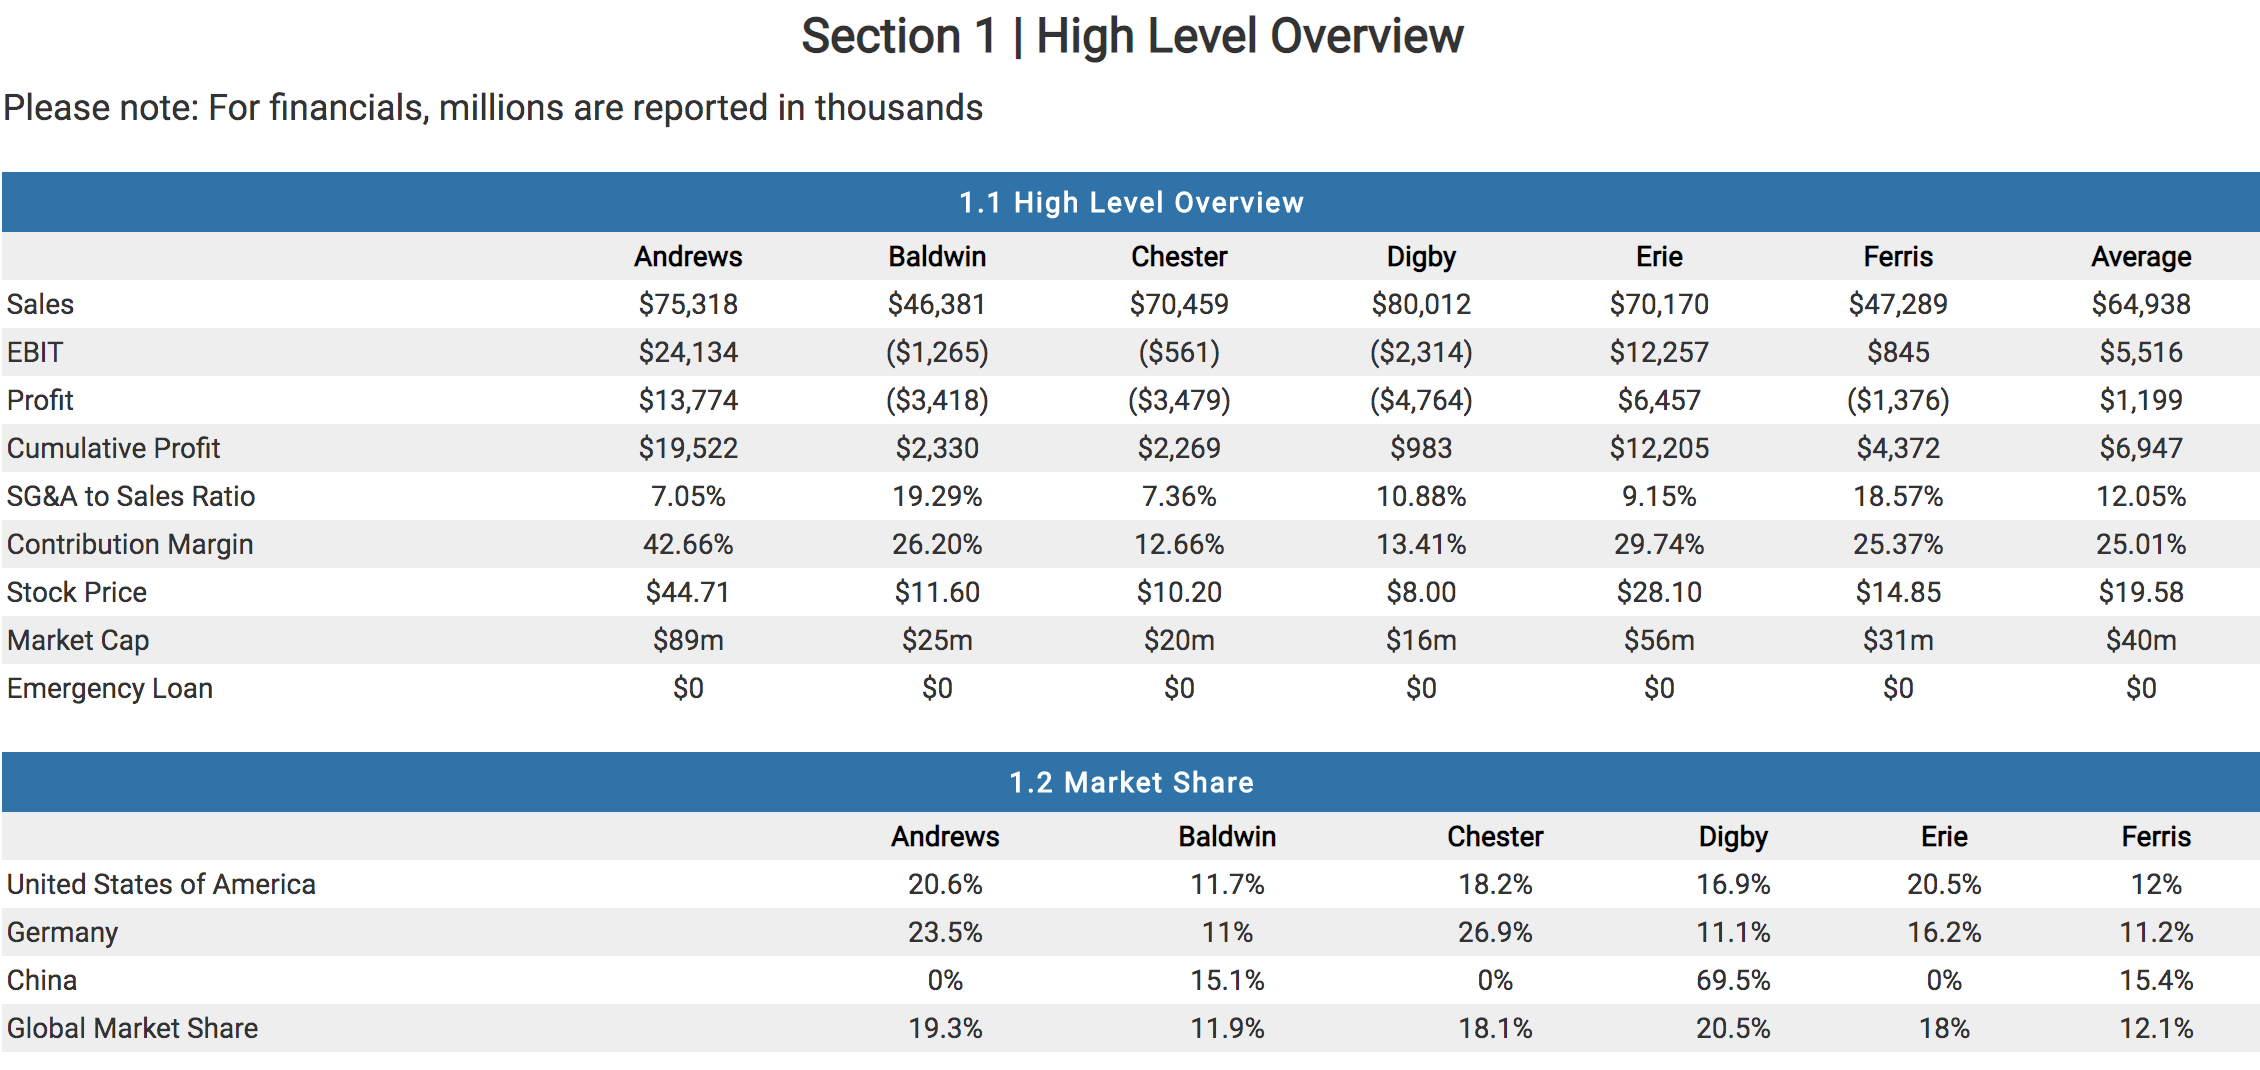
Section 1 | High Level Overview Please note: For financials, millions are reported in thousands 1.1 High Level Overview Andrews Baldwin Chester Digby Erie Ferris Average Sales $75,318 $46,381 $70,459 $80,012 $70, 170 $47,289 $64,938 EBIT $24,134 ($1,265) ($561) ($2,314) $12,257 $845 $5,516 Profit $13,774 ($3,418) ($3,479) ($4,764) $6,457 ($1,376) $1,199 Cumulative Profit $19,522 $2,330 $2,269 $983 $12,205 $4,372 $6,947 SG&A to Sales Ratio 7.05% 19.29% 7.36% 10.88% 9.15% 18.57% 12.05% Contribution Margin 42.66% 26.20% 12.66% 13.41% 29.74% 25.37% 25.01% Stock Price $44.71 $11.60 $10.20 $8.00 $28.10 $14.85 $19.58 Market Cap $89m $25m $20m $16m $56m $31m $40m Emergency Loan $0 SO SO SO 1.2 Market Share Andrews Baldwin Chester Digby Erie Ferris United States of America 20.6% 11.7% 18.2% 16.9% 20.5% 12% Germany 23.5% 11% 26.9% 11.1% 16.2% 11.2% China 0% 15.1% 0% 69.5% 0% 15.4% Global Market Share 19.3% 11.9% 18.1% 20.5% 18% 12.1%
Step by Step Solution
There are 3 Steps involved in it

Get step-by-step solutions from verified subject matter experts