

Question: (5pts) Graphing Data Set C Tire pressure is, in part, a function of the temperature of the tire Data Set C: First, examine the data
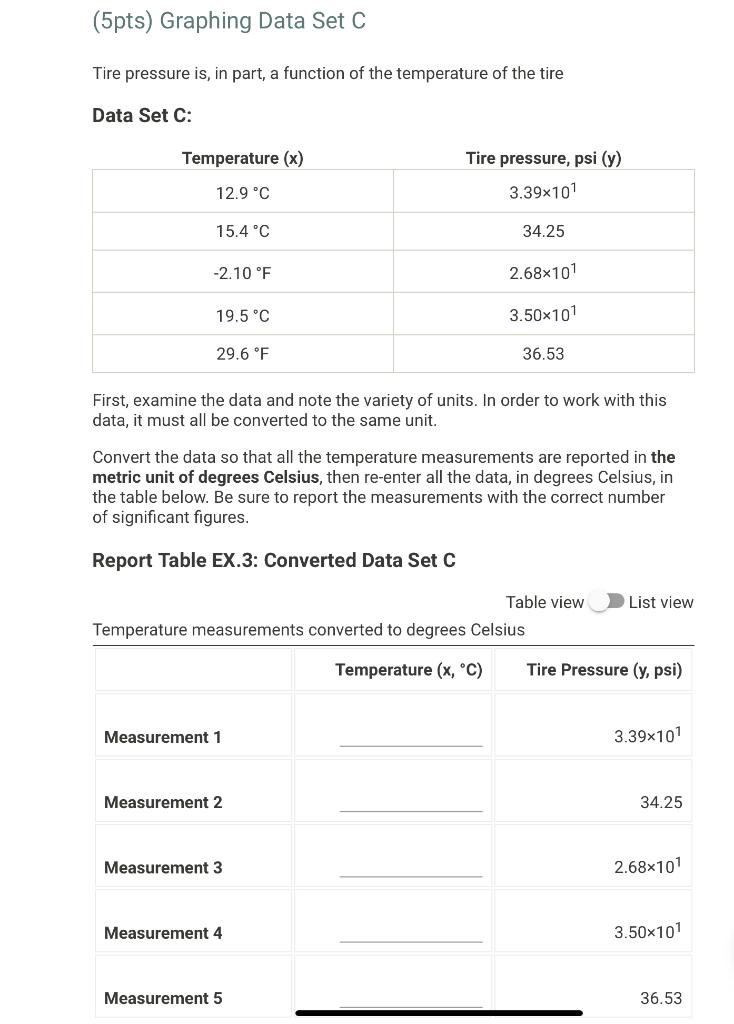
(5pts) Graphing Data Set C Tire pressure is, in part, a function of the temperature of the tire Data Set C: First, examine the data and note the variety of units. In order to work with this data, it must all be converted to the same unit. Convert the data so that all the temperature measurements are reported in the metric unit of degrees Celsius, then re-enter all the data, in degrees Celsius, in the table below. Be sure to report the measurements with the correct number of significant figures. Report Table EX.3: Converted Data Set C Table view List view (1pts) Based on everyday experience, state (in words) the relationship between tire pressure and temperature. Look at the data and see if the numbers support your statement. (6pts) Question 2 Prepare a hand-drawn plot of the two variables using the grid sheet in the lab manual or other graph paper. a. Include a title, axis labels (with units), and a trendline. (1pts) b. Estimate the tire manual or other graph paper. a. Include a title, axis labels (with units), and a trendline. (1pts) b. Estimate the tire pressure when the temperature is 18.6C. Tire pressure (psi) (1pts) c. Estimate the temperature of the air in the tire when the pressure is 37.0psi. Temperature (C) (4pts) d. Attach a picture of the fully labelled, hand-drawn plot here. (5pts) Question 3 Prepare a plot using graphing software. (5pts) a. Include a title, axis labels (with units), the equation of the best-fit line and the R2 value on the graph. b. Re-write the equation of the best-fit line substituting "Temperature" for x and "Pressure" for y directly on the graph. c. Attach a picture of the fully labeled computer generated graph or your Excel file containing the graph here. What is the value of the slope for the relationship between temperature and pressure? (1pts) Slope (psi/C) : (1pts) Question 5 Determine the percent error using Equation EX.1 and an value of 0.145psi/C for the "actual" value of the slope. %error=ActualActualExperimental100EquationEX.1 (1pts) Percent error (\%) (3pts) Question 6 Using your computer-generated graph: (1pts) a. Visually estimate the tire pressure when the temperature is 18.6C. Tire pressure (psi) (1pts) b. Calculate the tire pressure when temperature =18.6C using the equation of the best-fit line. Use the graph to ensure that this value is reasonable. Tire pressure (psi) (1pts) c) Compare the calculated pressure to the two visually interpolated values (Steps 2b and 6a ). Briefly discuss any discrepancies. Using your computer-generated graph: (1pts) a. Visually estimate the temperature of the air in the tire when the pressure is 37.0 psi. Temperature (C) (1pts) b. Calculate the temperature of the air in the tire when tire pressure =37.0psi. Use the graph to ensure that this value is reasonable. Temperature (C) (1pts) c) Compare the calculated temperature to the two visually interpolated values (Steps 2c and 7a ). Briefly discuss any discrepancies
Step by Step Solution
There are 3 Steps involved in it

Get step-by-step solutions from verified subject matter experts