

Question: 6 0 Multiple Choice 1 point Average Total Figure 1 3 . 9 Cosis ( 3 ) per day Refer to Figure 1 3 -
Multiple Choice
point
Average Total
Figure Cosis
per day
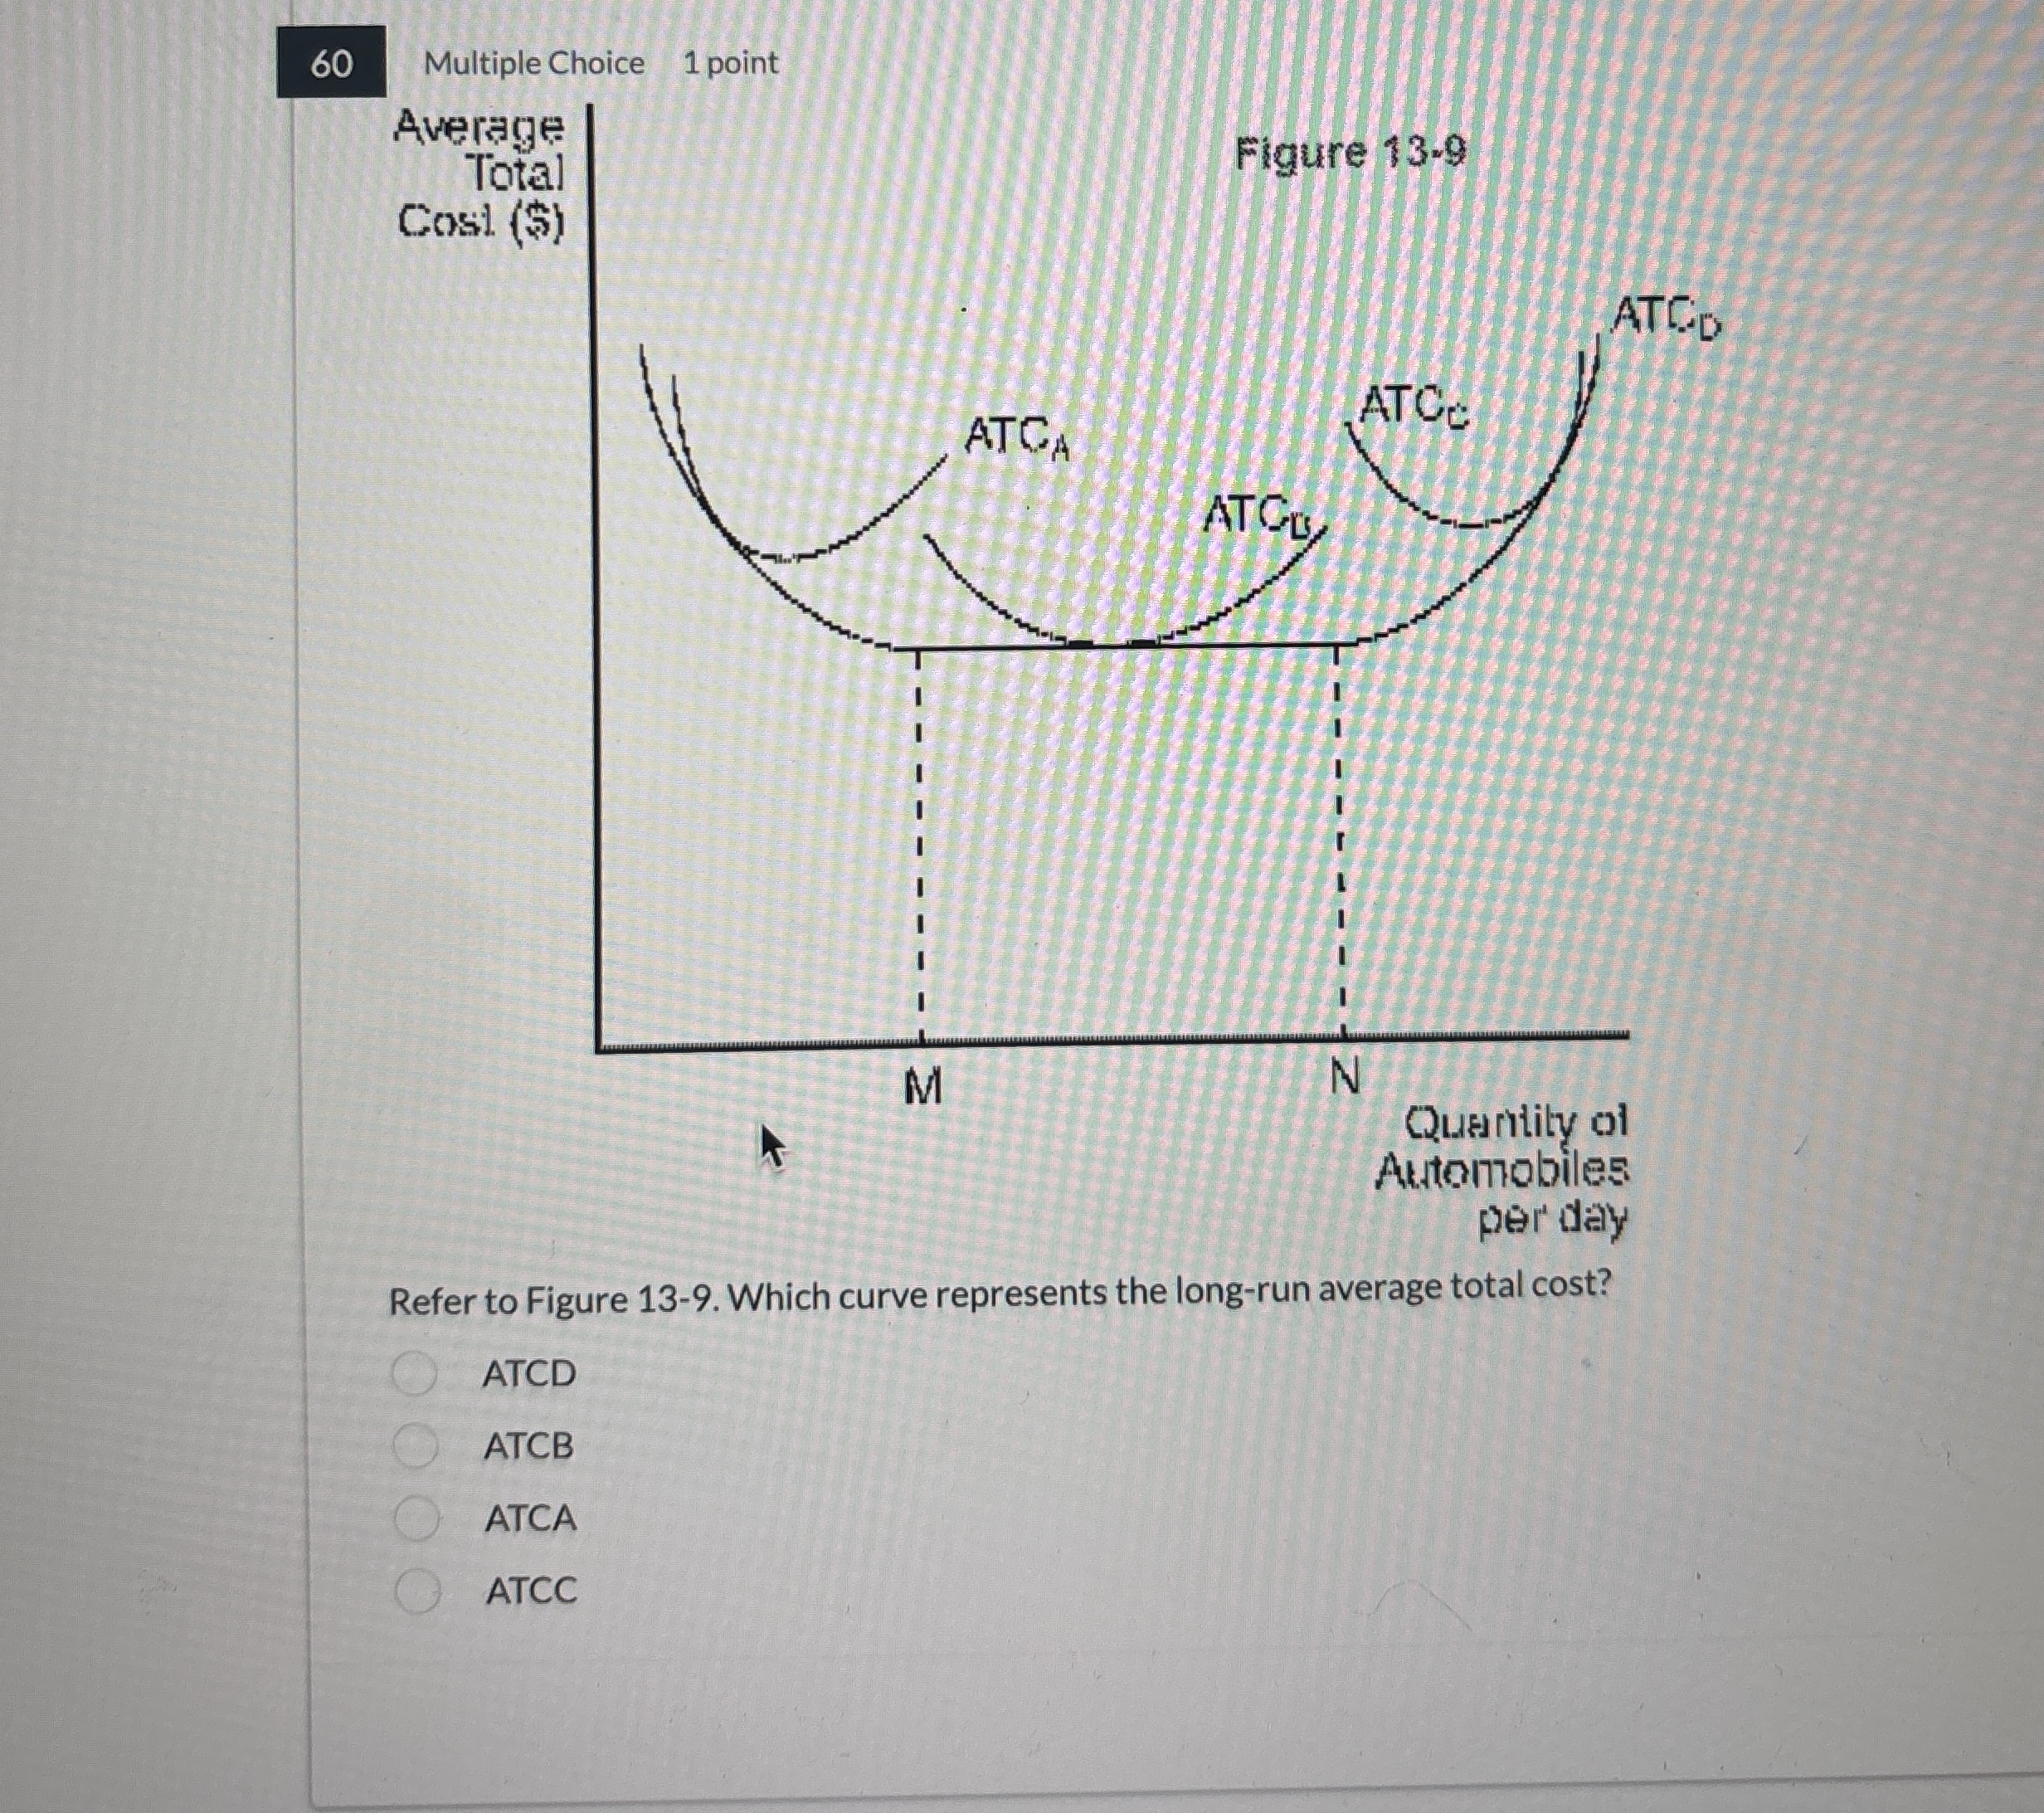
Refer to Figure Which curve represents the longrun average total cost?
ATCD
ATCB
ATCA
ATCC
Step by Step Solution
There are 3 Steps involved in it
1 Expert Approved Answer
Step: 1 Unlock

Question Has Been Solved by an Expert!
Get step-by-step solutions from verified subject matter experts
Step: 2 Unlock
Step: 3 Unlock