

Question: 6 : 1 4 1 HW 4 _ 7 cac 3 3 0 4 a 5 f 1 1 1 5 ba 0 d 3
:
HWcacafbade
Done
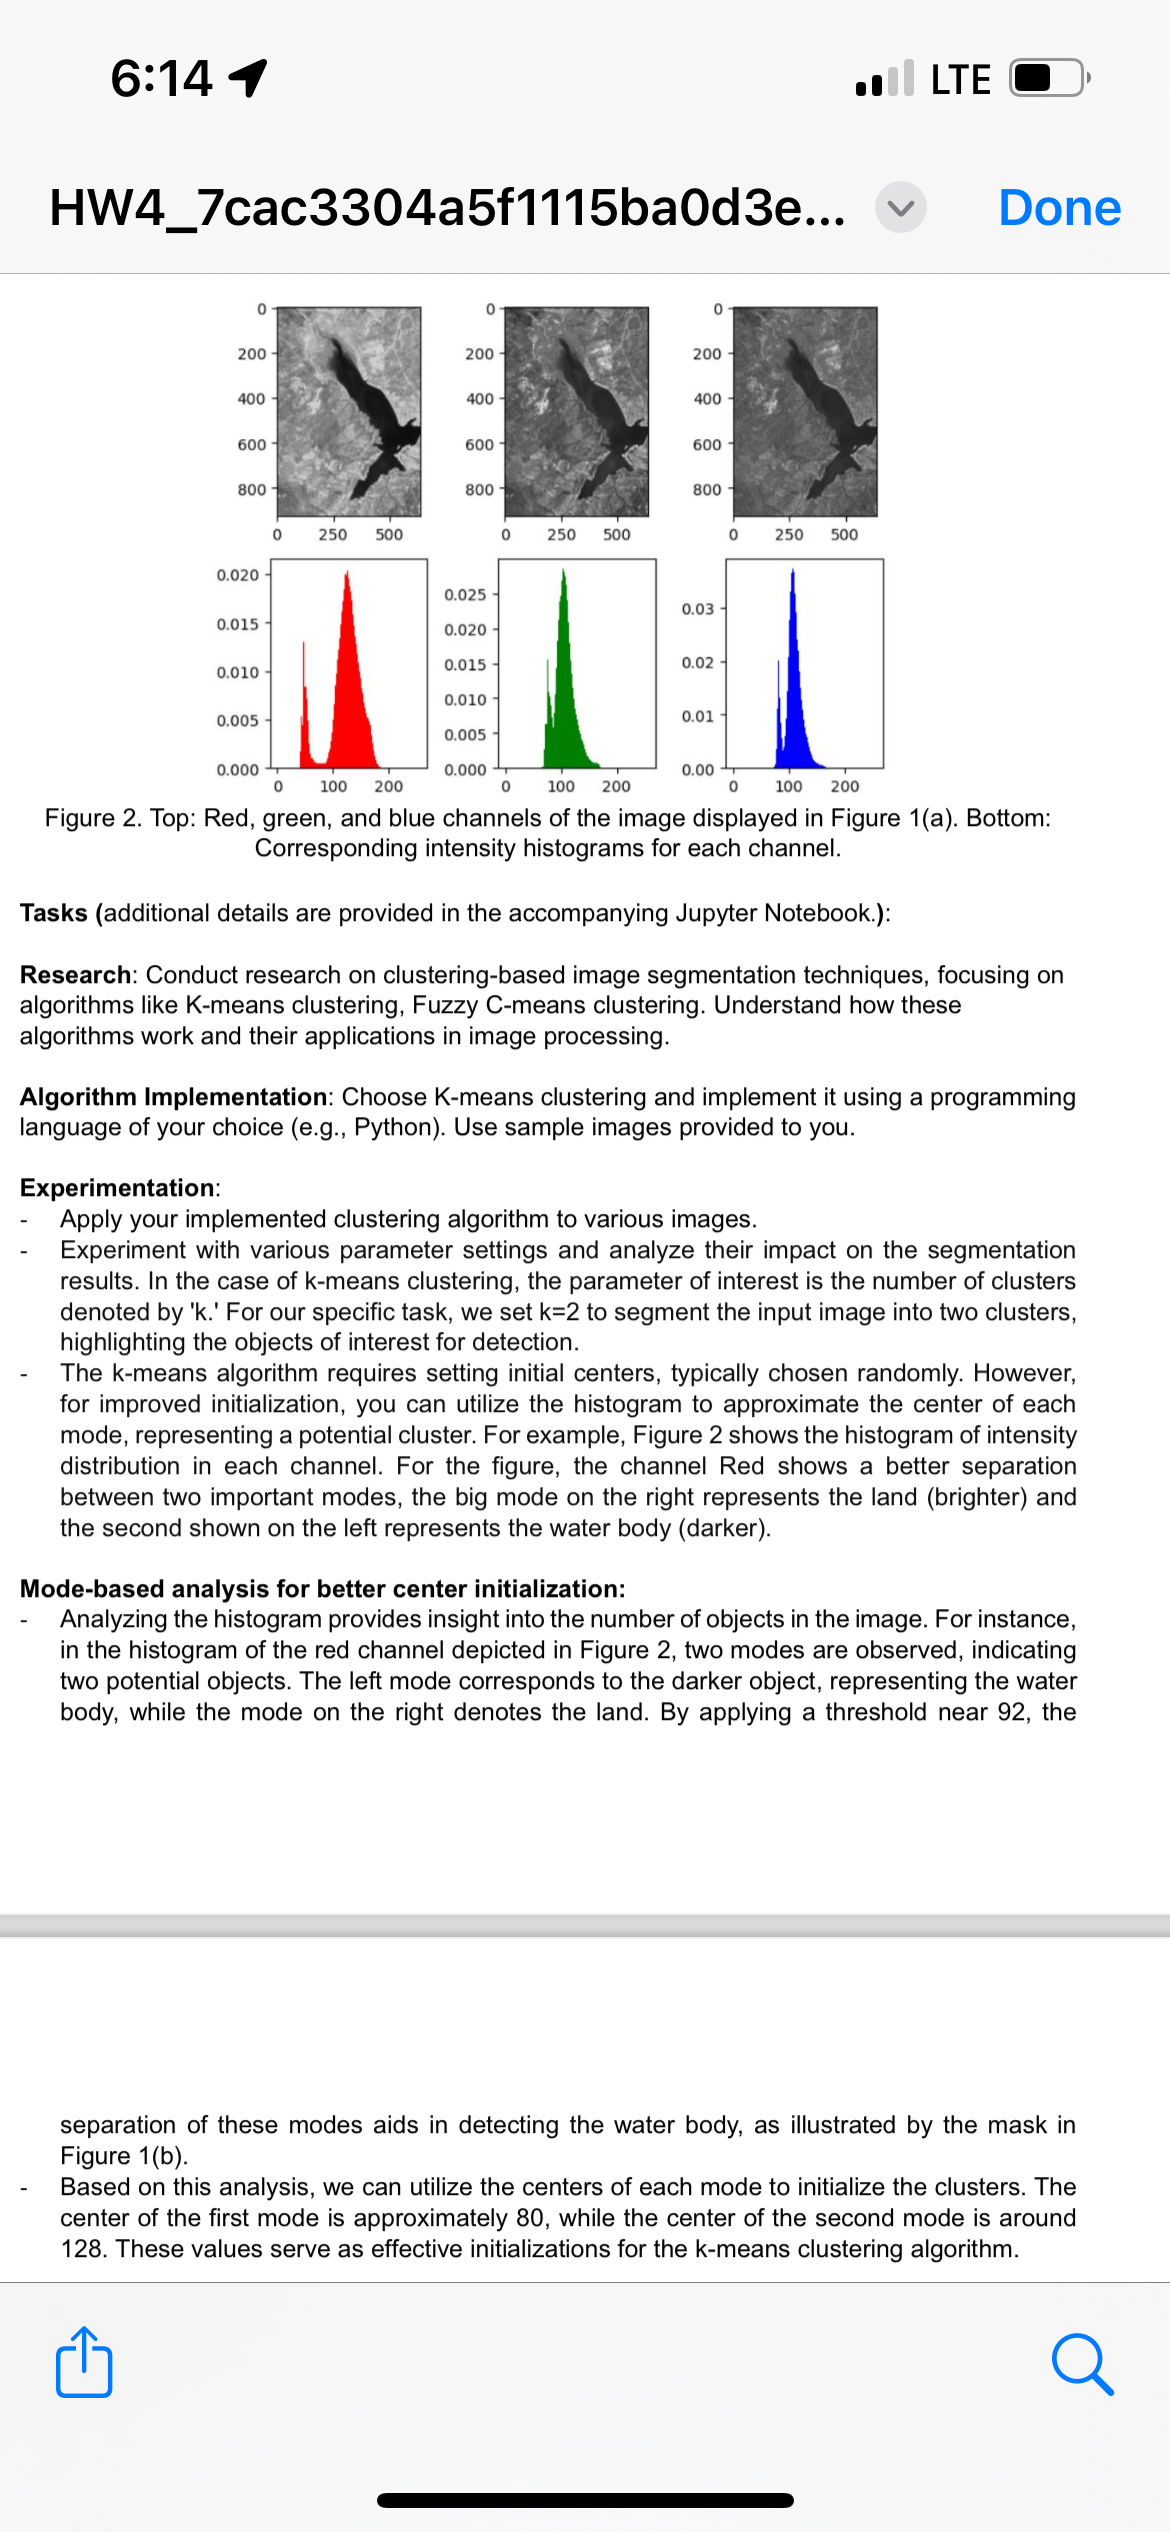
Figure Top: Red, green, and blue channels of the image displayed in Figure a Bottom: Corresponding intensity histograms for each channel.
Tasks additional details are provided in the accompanying Jupyter Notebook.:
Research: Conduct research on clusteringbased image segmentation techniques, focusing on algorithms like Kmeans clustering, Fuzzy Cmeans clustering. Understand how these algorithms work and their applications in image processing.
Algorithm Implementation: Choose Kmeans clustering and implement it using a programming language of your choice eg Python Use sample images provided to you.
Experimentation:
Apply your implemented clustering algorithm to various images.
Experiment with various parameter settings and analyze their impact on the segmentation results. In the case of kmeans clustering, the parameter of interest is the number of clusters denoted by k For our specific task, we set to segment the input image into two clusters, highlighting the objects of interest for detection.
The kmeans algorithm requires setting initial centers, typically chosen randomly. However, for improved initialization, you can utilize the histogram to approximate the center of each mode, representing a potential cluster. For example, Figure shows the histogram of intensity distribution in each channel. For the figure, the channel Red shows a better separation between two important modes, the big mode on the right represents the land brighter and the second shown on the left represents the water body darker
Modebased analysis for better center initialization:
Analyzing the histogram provides insight into the number of objects in the image. For instance, in the histogram of the red channel depicted in Figure two modes are observed, indicating two potential objects. The left mode corresponds to the darker object, representing the water body, while the mode on the right denotes the land. By applying a threshold near the
separation of these modes aids in detecting the water body, as illustrated by the mask in Figure b
Based on this analysis, we can utilize the centers of each mode to initialize the clusters. The center of the first mode is approximately while the center of the second mode is around These values serve as effective initializations for the kmeans clustering algorithm.
Step by Step Solution
There are 3 Steps involved in it
1 Expert Approved Answer
Step: 1 Unlock

Question Has Been Solved by an Expert!
Get step-by-step solutions from verified subject matter experts
Step: 2 Unlock
Step: 3 Unlock