

Question: 6 . ( 1 5 points ) . During a slug test, a volume of water was introduced ( figure below ) , the initial
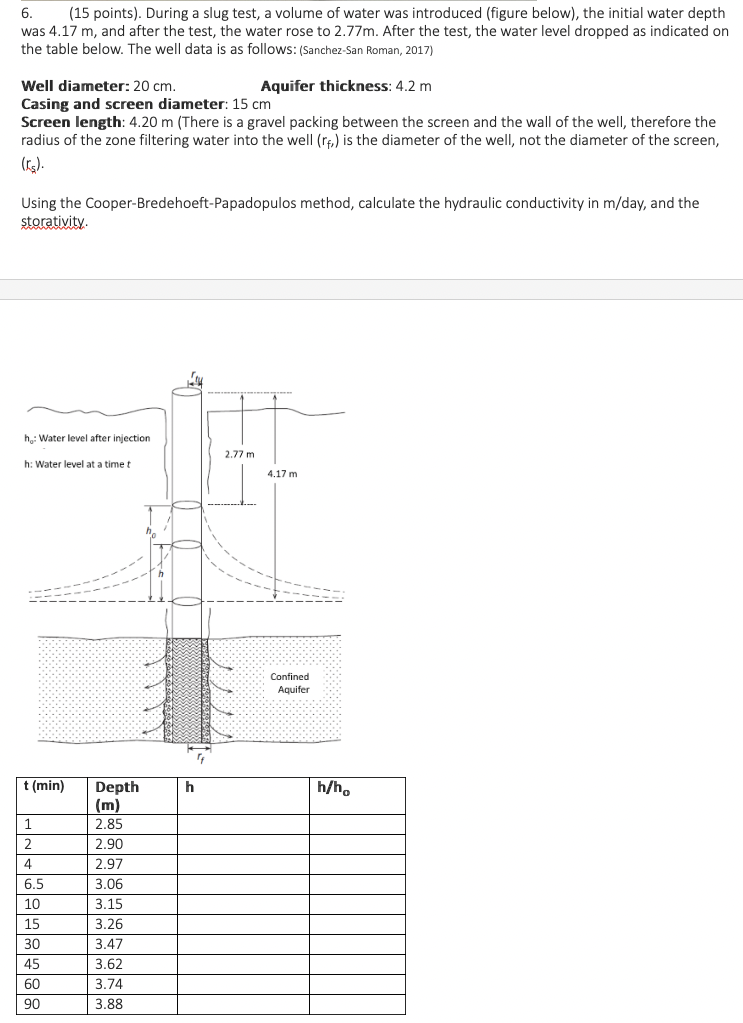
points During a slug test, a volume of water was introduced figure below the initial water depth was m and after the test, the water rose to m After the test, the water level dropped as indicated on the table below. The well data is as follows: SanchezSan Roman,
Well diameter: cm
Aquifer thickness: m
Casing and screen diameter: cm
Screen length: m There is a gravel packing between the screen and the wall of the well, therefore the radius of the zone filtering water into the well rf is the diameter of the well, not the diameter of the screen, leftmathrmrtext s right
Using the CooperBredehoeftPapadopulos method, calculate the hydraulic conductivity in mathrmmmathrmday and the storativity.
Step by Step Solution
There are 3 Steps involved in it
1 Expert Approved Answer
Step: 1 Unlock

Question Has Been Solved by an Expert!
Get step-by-step solutions from verified subject matter experts
Step: 2 Unlock
Step: 3 Unlock