

Question: 6. 10 points The data below give X = water content of snow on April 1 and Y = water yield from April to July
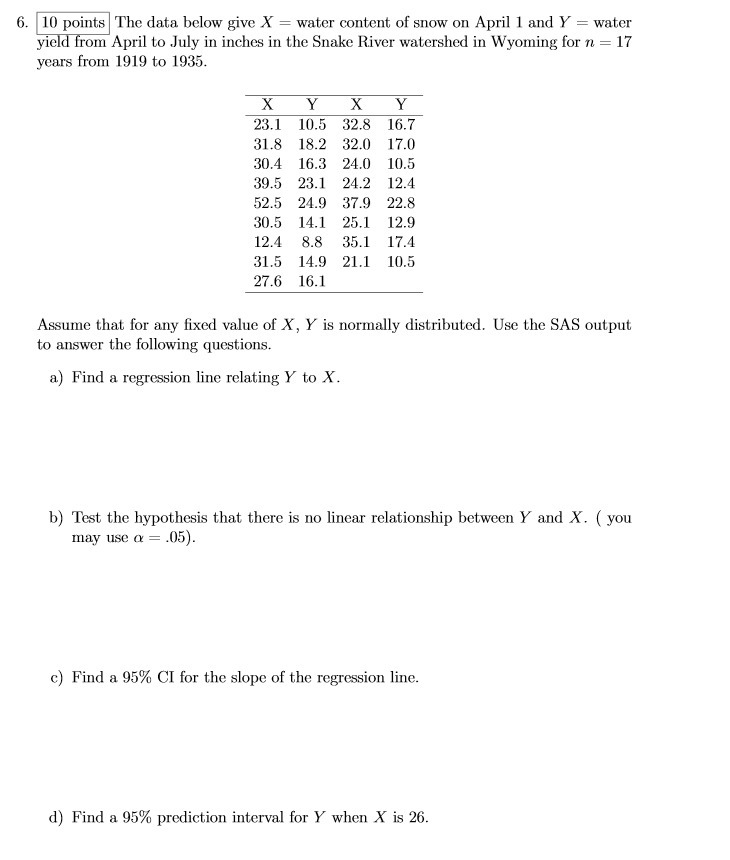
6. 10 points The data below give X = water content of snow on April 1 and Y = water yield from April to July in inches in the Snake River watershed in Wyoming for n = 17 years from 1919 to 1935. X Y X Y 23.1 10.5 32.8 16.7 31.8 18.2 32.0 17.0 30.4 16.3 24.0 10.5 39.5 23.1 24.2 12.4 52.5 24.9 37.9 22.8 30.5 14.1 25.1 12.9 12.4 8.8 35.1 17.4 31.5 14.9 21.1 10.5 27.6 16.1 Assume that for any fixed value of X, Y is normally distributed. Use the SAS output to answer the following questions. a) Find a regression line relating Y to X. b) Test the hypothesis that there is no linear relationship between Y and X. ( you may use a = .05). c) Find a 95% CI for the slope of the regression line. d) Find a 95% prediction interval for Y when X is 26
Step by Step Solution
There are 3 Steps involved in it

Get step-by-step solutions from verified subject matter experts