

Question: 6 . 2 4 . Consider the x and R chart that you established in Exercise 6 . 1 5 for the piston ring process.
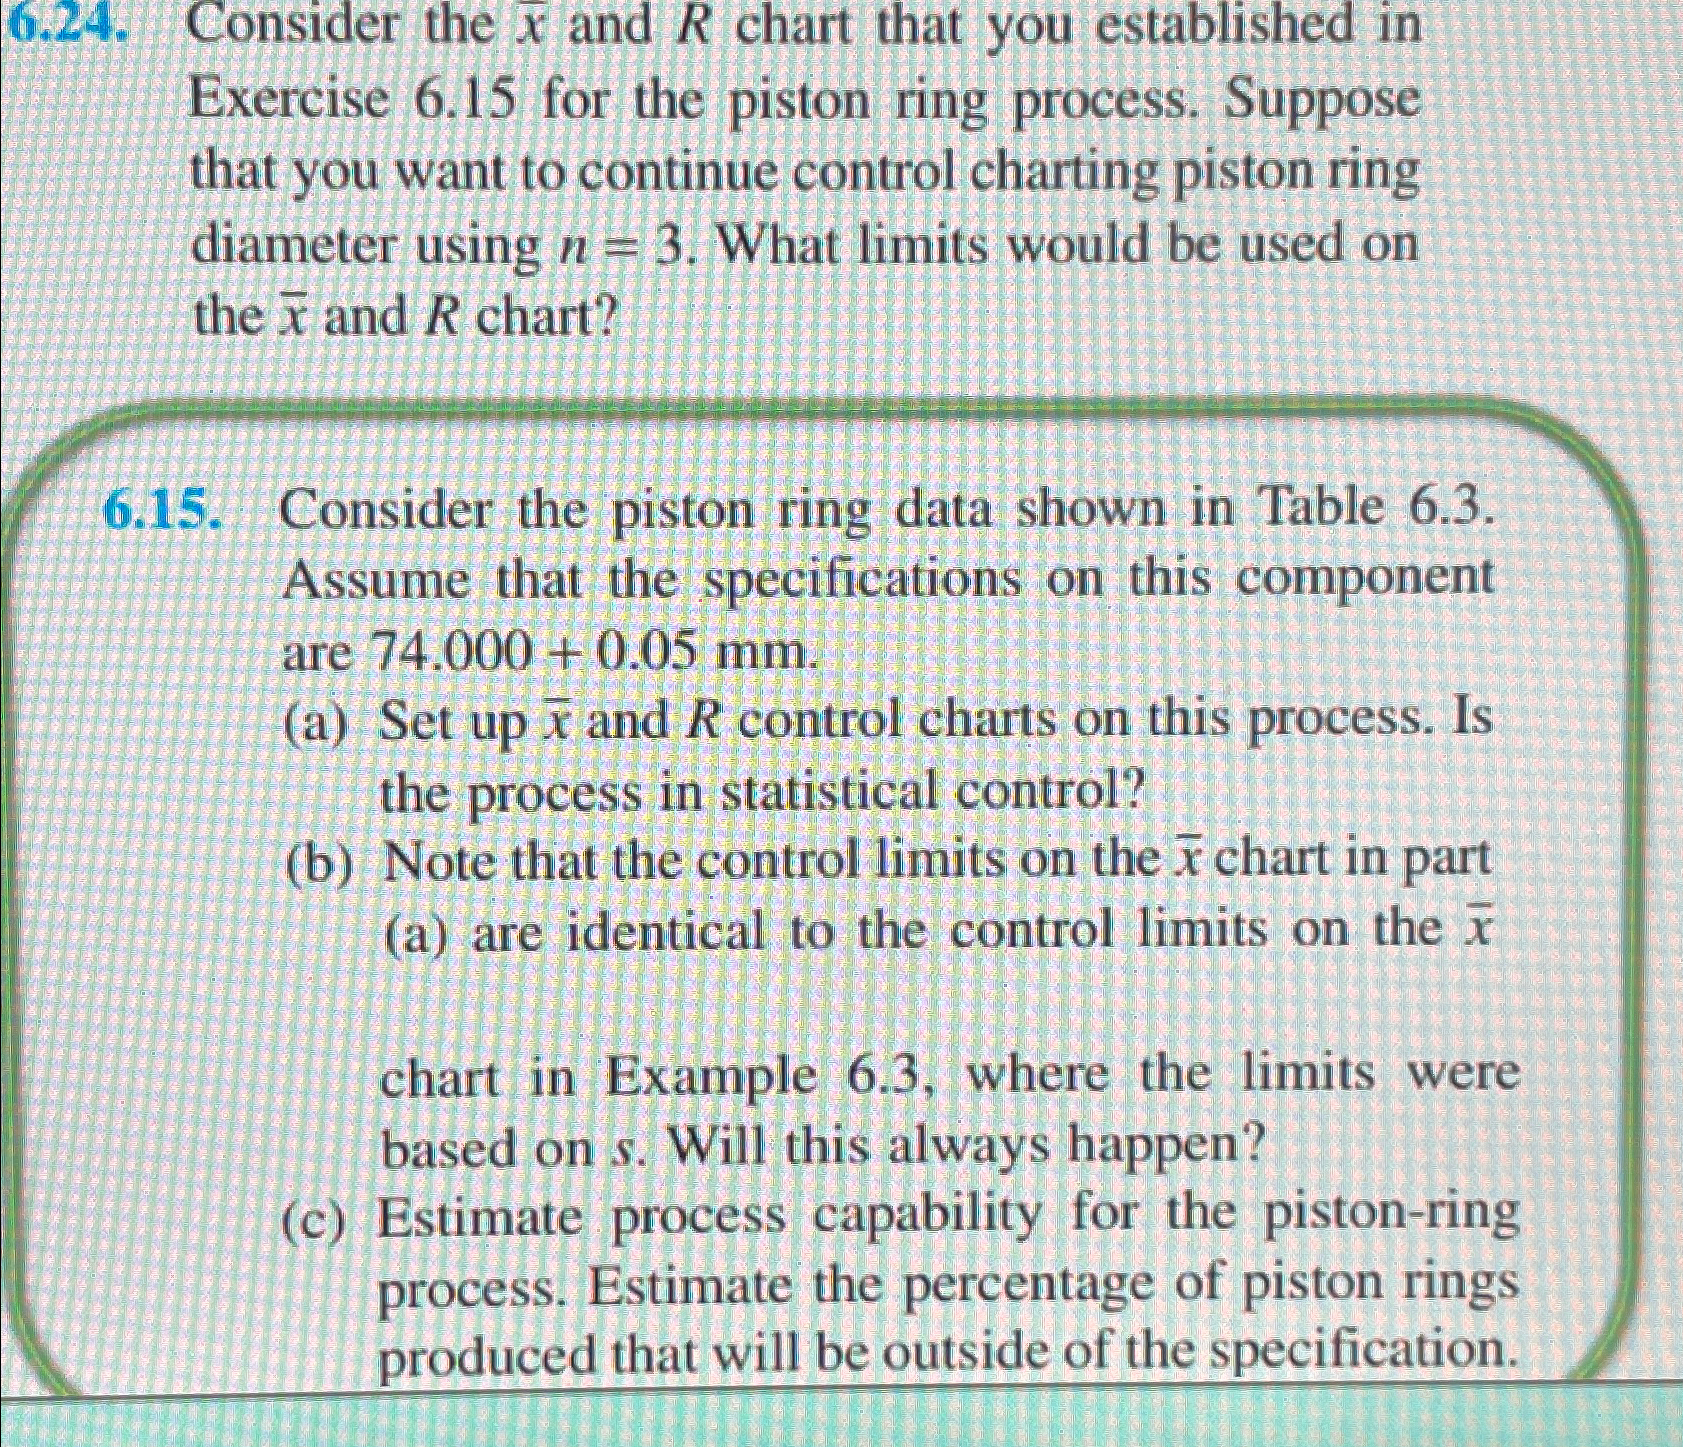
Consider the and chart that you established in Exercise for the piston ring process. Suppose that you want to continue control charting piston ring diameter using What limits would be used on the and chart?
Consider the piston ring data shown in Table Assume that the specifications on this component are
a Set up and control charts on this process. Is the process in statistical control?
b Note that the control limits on the chart in part a are identical to the control limits on the chart in Example where the limits were based on Will this always happen?
c Estimate process capability for the pistonring process. Estimate the percentage of piston rings produced that will be outside of the specification.
Step by Step Solution
There are 3 Steps involved in it
1 Expert Approved Answer
Step: 1 Unlock

Question Has Been Solved by an Expert!
Get step-by-step solutions from verified subject matter experts
Step: 2 Unlock
Step: 3 Unlock