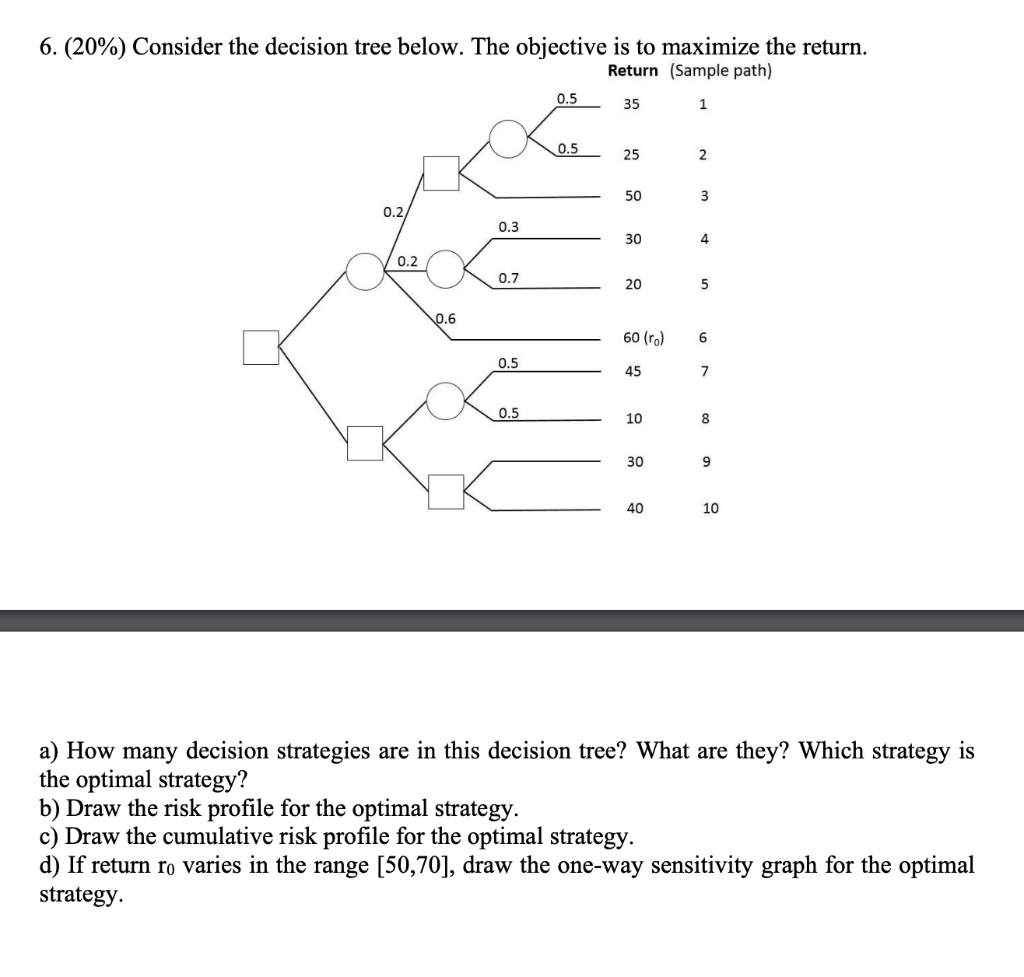
Question: 6. (20%) Consider the decision tree below. The objective is to maximize the return. Return (Sample path) 0.5 35 1 0.5 25 2 50 3

6. (20%) Consider the decision tree below. The

6. (20%) Consider the decision tree below. The objective is to maximize the return. Return (Sample path) 0.5 35 1 0.5 25 2 50 3 0.2 0.3 30 4 0.2 0.7 20 5 0.6 60 (0) 6 0.5 45 7 0.5 10 8 30 9 40 10 a) How many decision strategies are in this decision tree? What are they? Which strategy is the optimal strategy? b) Draw the risk profile for the optimal strategy. c) Draw the cumulative risk profile for the optimal strategy. d) If return ro varies in the range [50,70), draw the one-way sensitivity graph for the optimal strategy. 6. (20%) Consider the decision tree below. The objective is to maximize the return. Return (Sample path) 0.5 35 1 0.5 25 2 50 3 0.2 0.3 30 4 0.2 0.7 20 5 0.6 60 (0) 6 0.5 45 7 0.5 10 8 30 9 40 10 a) How many decision strategies are in this decision tree? What are they? Which strategy is the optimal strategy? b) Draw the risk profile for the optimal strategy. c) Draw the cumulative risk profile for the optimal strategy. d) If return ro varies in the range [50,70), draw the one-way sensitivity graph for the optimal strategy

Step by Step Solution

There are 3 Steps involved in it

1 Expert Approved Answer
Step: 1 Unlock blur-text-image
Question Has Been Solved by an Expert!

Get step-by-step solutions from verified subject matter experts

Step: 2 Unlock
Step: 3 Unlock

Students Have Also Explored These Related General Management Questions!