

Question: 6. (25 points) Randomness and Autocorrelations. Using a computer program such as Matlab, Excel, Mathematica, or MathCAD create a vector of 100 random numbers using
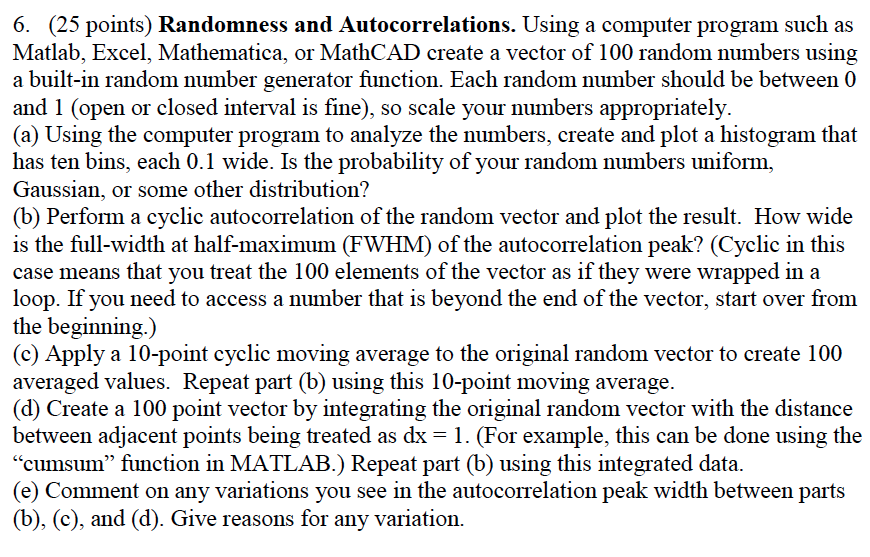
6. (25 points) Randomness and Autocorrelations. Using a computer program such as Matlab, Excel, Mathematica, or MathCAD create a vector of 100 random numbers using a built-in random number generator function. Each random number should be between 0 and 1 (open or closed interval is fine), so scale your numbers appropriately. (a) Using the computer program to analyze the numbers, create and plot a histogram that has ten bins, each 0.1 wide. Is the probability of your random numbers uniform, Gaussian, or some other distribution? (b) Perform a cyclic autocorrelation of the random vector and plot the result. How wide is the full-width at half-maximum (FWHM) of the autocorrelation peak? (Cyclic in this case means that you treat the 100 elements of the vector as if they were wrapped in a loop. If you need to access a number that is beyond the end of the vector, start over from the beginning.) (c) Apply a 10-point cyclic moving average to the original random vector to create 100 averaged values. Repeat part (b) using this 10-point moving average. (d) Create a 100 point vector by integrating the original random vector with the distance between adjacent points being treated as dx-1. (For example, this can be done using the "cumsum" function in MATLAB.) Repeat part (b) using this integrated data (e) Comment on any variations you see in the autocorrelation peak width between parts (b), (c), and (d). Give reasons for any variation. 6. (25 points) Randomness and Autocorrelations. Using a computer program such as Matlab, Excel, Mathematica, or MathCAD create a vector of 100 random numbers using a built-in random number generator function. Each random number should be between 0 and 1 (open or closed interval is fine), so scale your numbers appropriately. (a) Using the computer program to analyze the numbers, create and plot a histogram that has ten bins, each 0.1 wide. Is the probability of your random numbers uniform, Gaussian, or some other distribution? (b) Perform a cyclic autocorrelation of the random vector and plot the result. How wide is the full-width at half-maximum (FWHM) of the autocorrelation peak? (Cyclic in this case means that you treat the 100 elements of the vector as if they were wrapped in a loop. If you need to access a number that is beyond the end of the vector, start over from the beginning.) (c) Apply a 10-point cyclic moving average to the original random vector to create 100 averaged values. Repeat part (b) using this 10-point moving average. (d) Create a 100 point vector by integrating the original random vector with the distance between adjacent points being treated as dx-1. (For example, this can be done using the "cumsum" function in MATLAB.) Repeat part (b) using this integrated data (e) Comment on any variations you see in the autocorrelation peak width between parts (b), (c), and (d). Give reasons for any variation
Step by Step Solution
There are 3 Steps involved in it

Get step-by-step solutions from verified subject matter experts